We’ve all had the same doubt at some point: “Is this market good for a boring grid or for a suicidal martingale?”
Well, I built an indicator that tries to answer exactly that. And no, it’s not magic — it’s volatility, trend, and momentum analysis… although sometimes it feels like wizardry.
What does this indicator do?
It scans up to 10 Bybit pairs and ranks them based on how attractive they are to trade. To decide that, it looks at three key factors:
- Volatility (ATR%) → measures how much the price is moving on 4H. If it’s not moving, why bother?
- Trend (ADX) → if the market is strong in one direction, the indicator suggests Martingale. If it’s weak and sideways, then Grid.
- Momentum (EMAs & RSI) → confirms if the price has real energy or if it’s just strolling around like it’s Sunday afternoon.
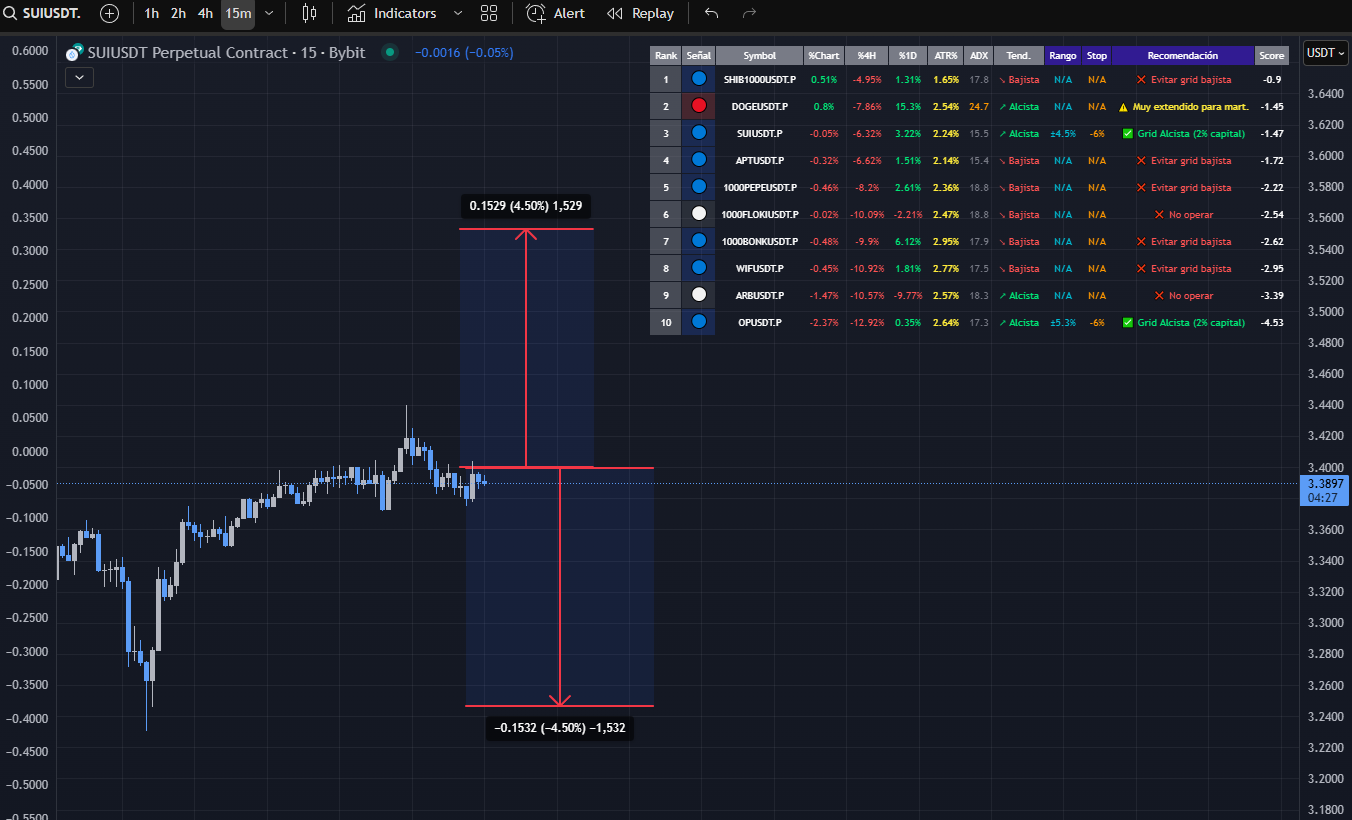
With all that, the system generates a ranking table that tells you:
- If Grid
 makes sense
 - If Martingale
 is the play
 - Or if it’s better to avoid

It also provides a suggested grid range, stop loss adjusted by volatility, and a quick recommendation with emojis (because sometimes an emoji says more than a paragraph).
 How does it decide Grid or Martingale?
- Grid: when the market is boringly sideways, with acceptable volatility and RSI in the middle zone. Basically, when nothing’s happening, that’s when Grid makes sense.
- Martingale: when there’s a strong and clear trend, EMAs aren’t crossing over each other, and ADX says “this is serious.” Perfect for those who enjoy doubling positions as if risk didn’t exist (spoiler: it does).
Warning
- Martingale isn’t for everyone: if you don’t have nerves of steel and plenty of capital, stick to demo. The market has a talent for proving you wrong.
- This won’t cure your trading: losses, drawdowns, and bad days still exist. Some days it’ll feel like the market is designed to make you quit and start a food truck instead.
- Always test before going live: this indicator helps with decision-making, but discipline is still 100% on you.
This indicator is a decision-making assistant:
- It shows which pairs are moving,
- Tells you when Grid or Martingale makes sense,
- And ranks them with ranges, stops, and easy-to-read recommendations.
It won’t trade for you (unfortunately), but it will save you time, boring analysis, and the occasional bad impulsive trade.
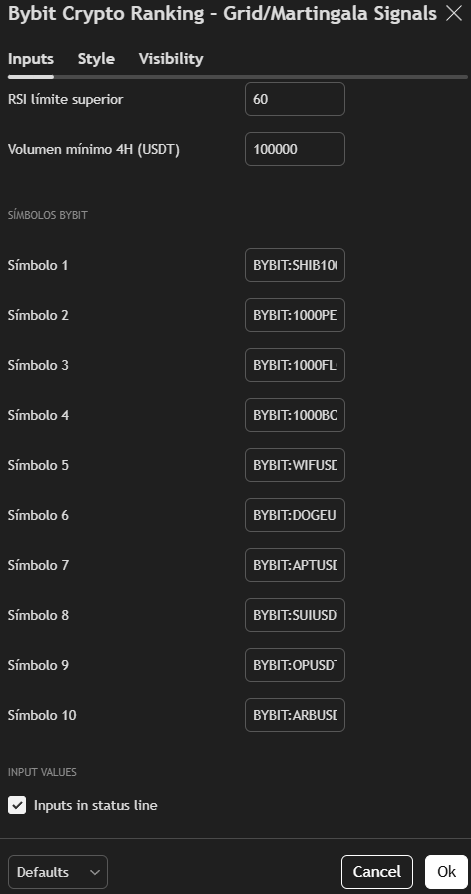
You can change the pairs you want to scan by going into the indicator settings.
Just make sure to respect the correct syntax so it doesn’t throw an error.
![]() Example:
Example: BYBIT:BTCUSDT.P
Swap BTC with any other Bybit pair you want to analyze.
This is, in very broad terms, what the indicator does. I assume most people here are at least moderately experienced traders, so you probably already get the logic behind the signals. But just in case anyone is still wondering—or simply wants to double-check their intuition—let’s break it down quickly.
Signals are generated when price breaks through key levels in combination with current volatility (measured by ATR) and trend strength (ADX). In plain English:
- If the market shows strength and breaks a level with volatility backing it up, you’ll get an entry signal.
- If the move has no “fuel” or volatility dies down, the indicator filters it out and avoids spamming you with useless alerts.
- In short, the logic is built to cut through the noise and highlight moments when price actually has intention.
One more thing: this is an indicator I built myself. You won’t find it floating around in some random public library. But since we’re in this community, I’m leaving the link below so members can access it. It’s open-source, so feel free to tweak it, adapt it, change the colors—or completely break it if that’s your thing.