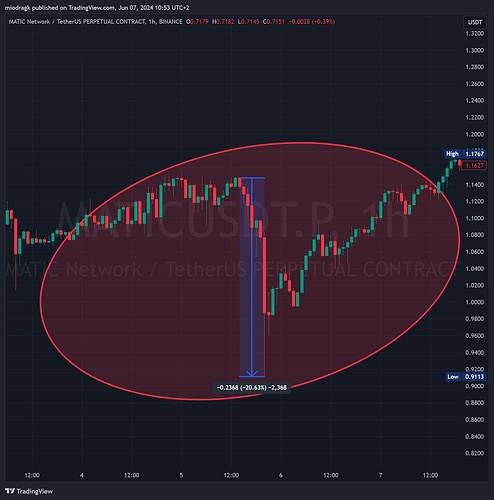
I analyzed the MATIC chart and noticed that during each bull cycle, there are strong corrections of 15-20% within a few hours, and then the growth continues as if nothing happened. We all know why these corrections occur: the market liquidates long positions.
I sat down to “chat” with ChatGPT about this phenomenon. It confirmed that I had correctly observed this pattern and listed exactly when these events occurred. After each of these events, the price increased by 50% or more.
I am thinking and planning how to develop this strategy.
Everyone is welcome to share their ideas.
During MATIC’s past uptrends, the cryptocurrency has indeed experienced several significant corrections, typically ranging between 15-20%. These corrections are common in volatile markets and often serve as consolidation phases before the continuation of the trend.
Historical Corrections:
- May 2021: In May 2021, MATIC experienced a sharp correction of about 20% after a rapid ascent. This was part of a broader market correction that affected many cryptocurrencies. MATIC’s price dropped from its peak of around $2.68 to approximately $2.14
- September 2021: Another significant correction occurred in September 2021, where MATIC fell approximately 18% from around $1.75 to $1.43. This correction happened amid overall market uncertainty and regulatory news impacting the broader cryptocurrency market
- November 2021: In November, MATIC experienced a correction of about 15% as part of a broader market pullback after a prolonged uptrend. The price fell from around $2.20 to $1.87 before resuming its upward trajectory
- April 2022: There was a notable correction of about 17% in April 2022, where MATIC’s price dropped from $1.65 to around $1.37. This correction coincided with market-wide declines in the crypto sector
This one happened in 6 bars (6 hrs).
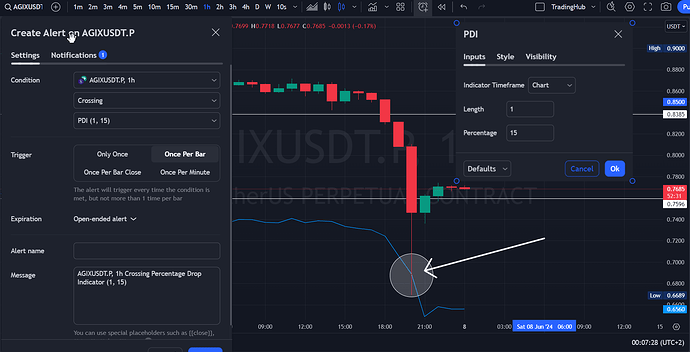
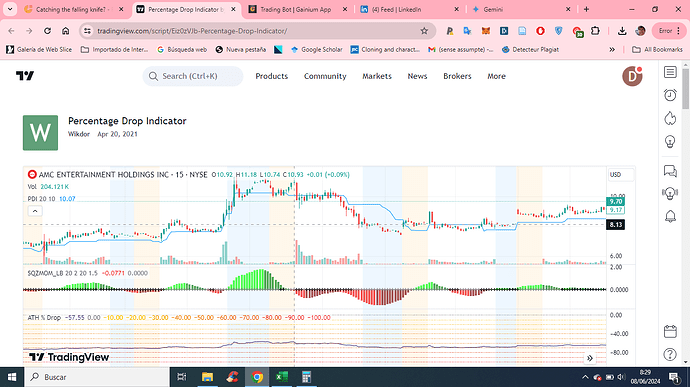
ChatGPT even helped me in creating an indicator for this purpose:
//@version=5
indicator(“Customizable Price Drop Alert”, overlay=true)// Input settings for the user
dropPercent = input.float(15.0, title=“Drop Percentage”, minval=0.0)
length = input.int(5, title=“Number of Bars”, minval=1)
useClose = input.bool(true, title=“Use Candle Close Price”, tooltip=“If false, uses the real-time price”)// Calculate the drop percentage from the highest price in the last ‘length’ candles to the chosen price
highPrice = ta.highest(high, length)
currentPrice = useClose ? close : closedrop = (highPrice - currentPrice) / highPrice * 100
// Define a constant message
alertMessage = “Price dropped by the specified percentage from the highest price in the specified number of bars”alertcondition(drop >= dropPercent, title=“Price Drop Alert”, message=alertMessage)
plotshape(series=drop >= dropPercent, location=location.belowbar, color=color.red, style=shape.labeldown, text=“Drop Alert”)


