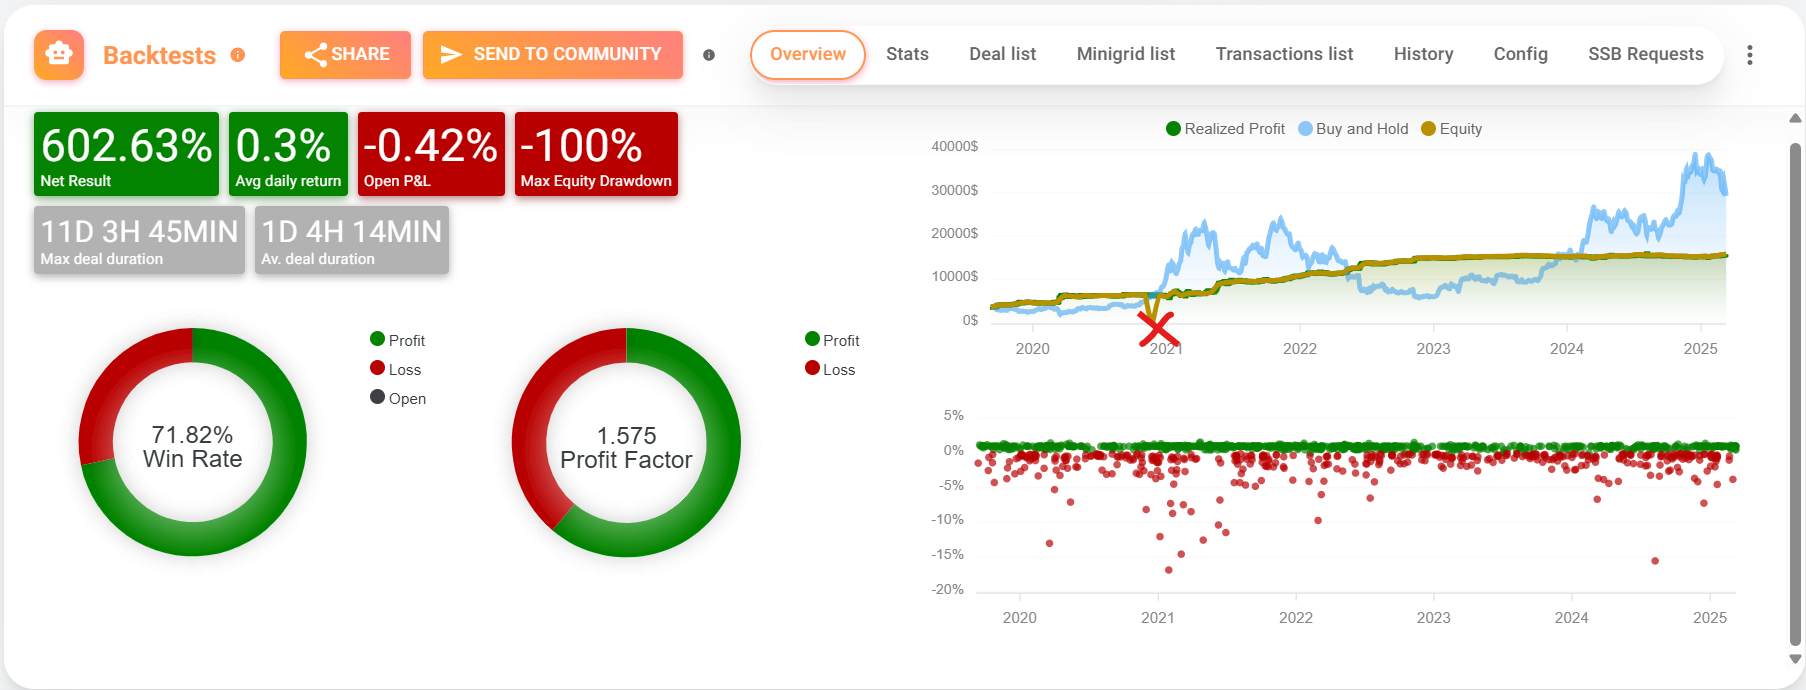
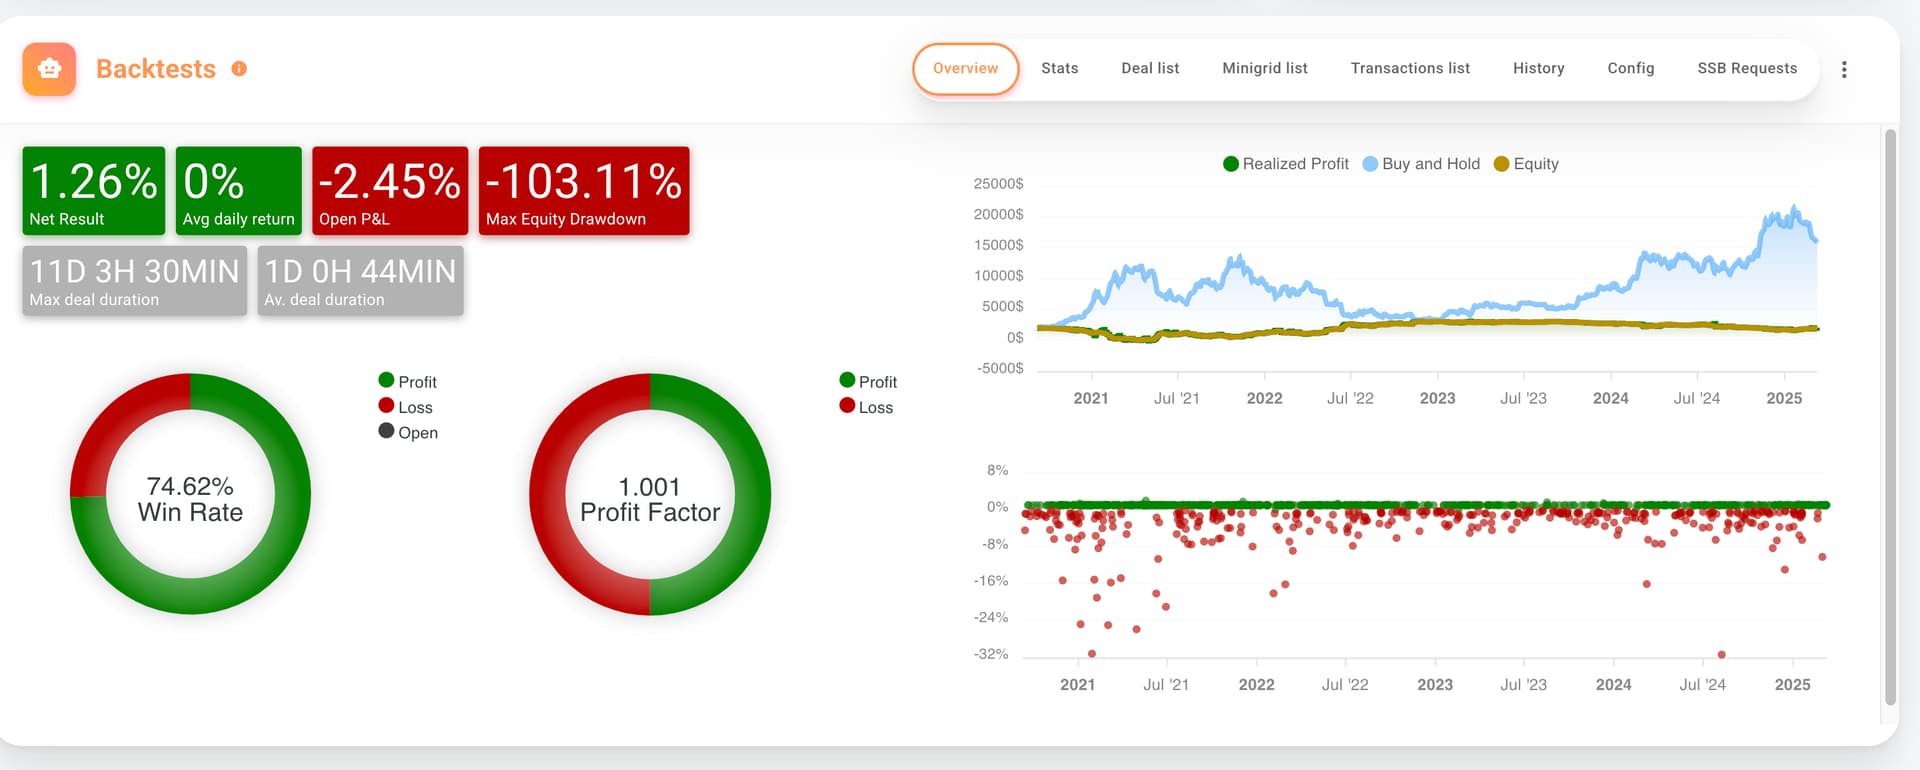
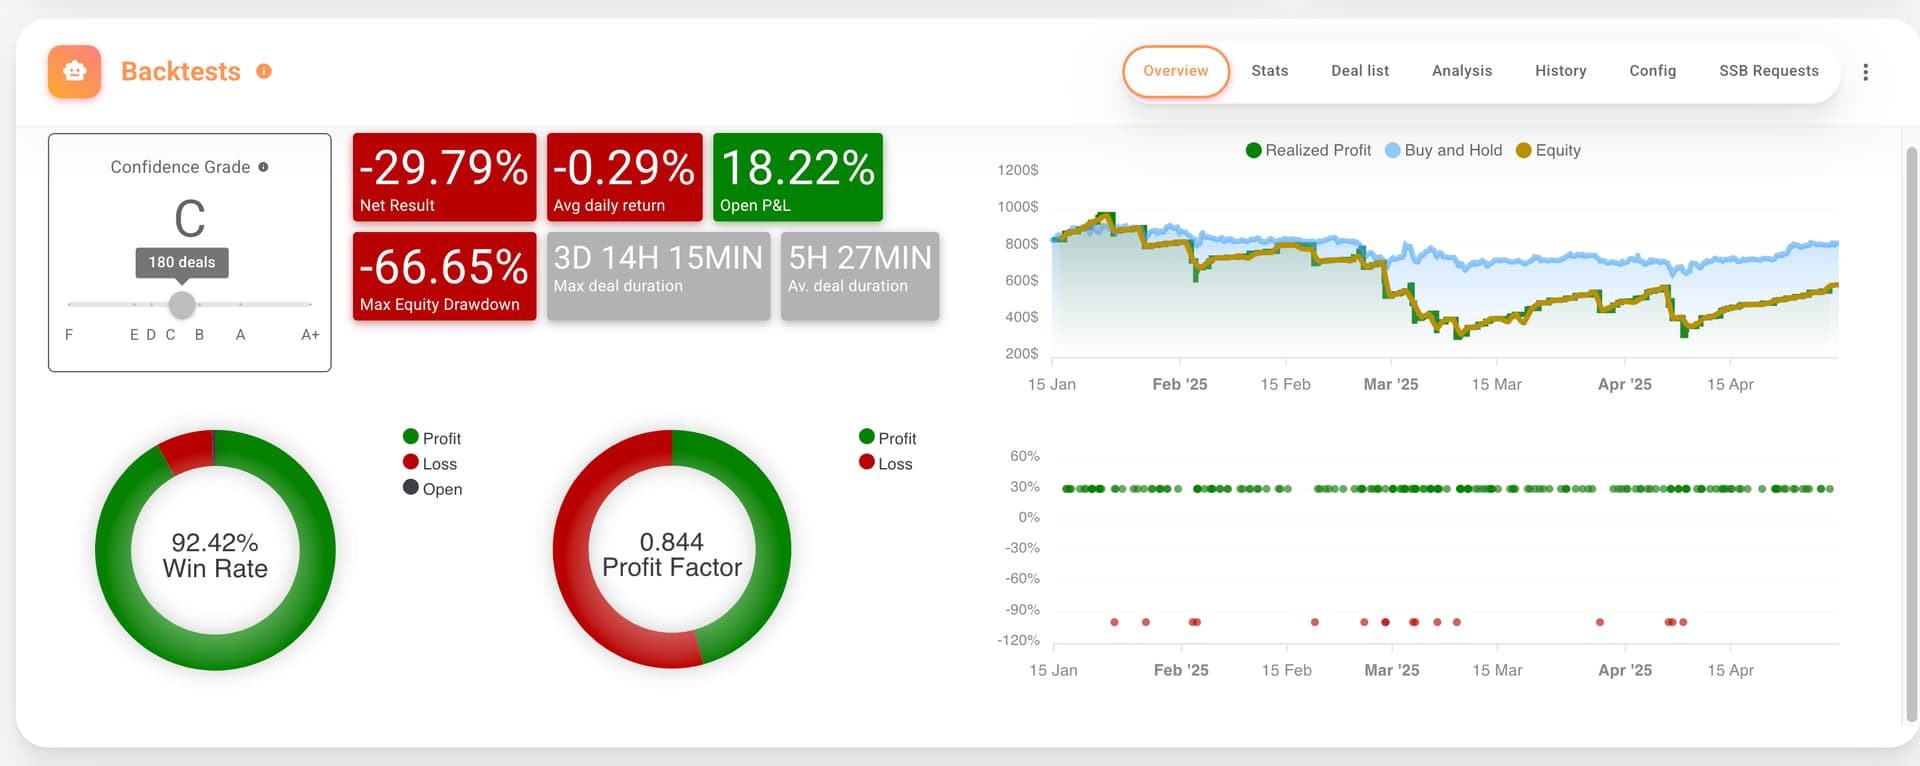
The Equity chart drops to 0 for one data point and the “Max Equity Drawdown” registers as -100%, yet the bot keeps on trading from the next data point as if nothing has happened. It does not seem to signify a liquidation and when I look at the open deal I had at this time as well as the relevant price behaviour, I cannot see anything untoward, such as a sharp adverse price move. So it certainly does not link to any “running equity drawdown”.
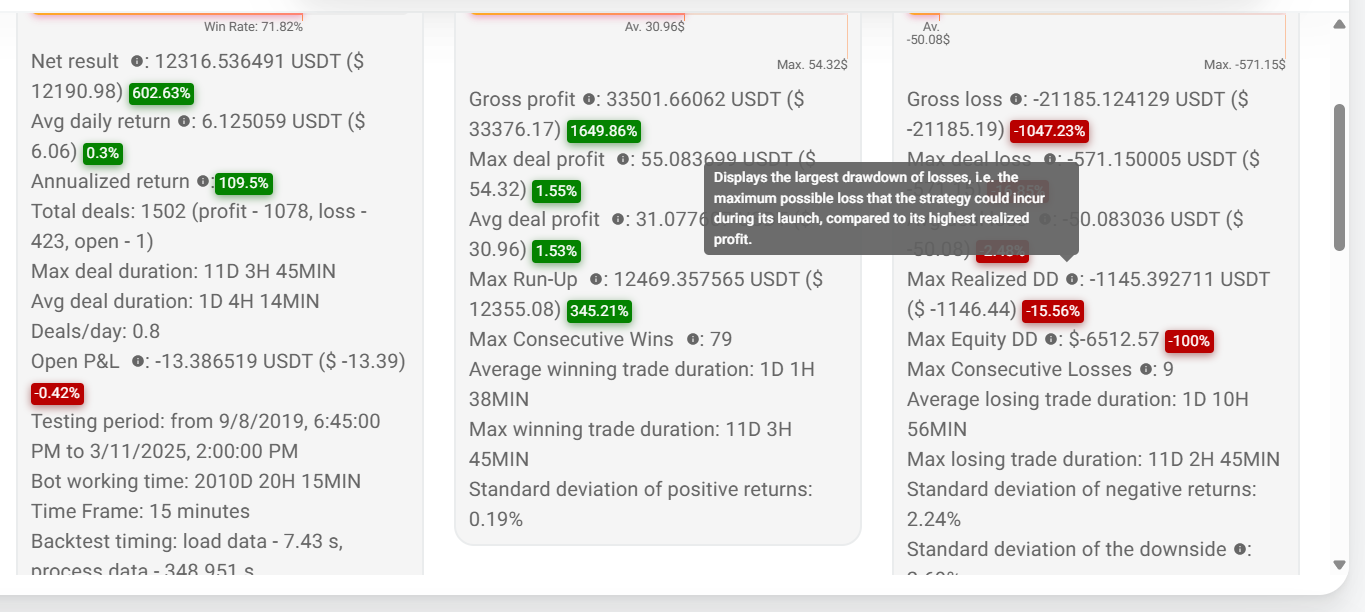
Also, the info bubble for “Max Realized DD” and “Max Equity DD” are identical - so I am in the dark as to what “Max Equity DD” actually means. Maybe if someone can share the formula of how it is calculated for each data point. I could not find anything in the help files and the videos that @aressanch have on YouTube.
Max equity drawdown is the drawdown of the funds that the bot is trading with. For example, if your bot can use up to $500 and, after operating, the lowest value of its quote plus base across all deals is $250, then the drawdown of equity is 50%.
-100% equity may indicate a liquidation or the accumulation of various losses; you can review the deal list to analyze what happened. The backtest assumes infinite funds. If the bot loses all initial equity, it assumes it can start another deal with new funds. So in reality the equity drawdown can be over 100%, meaning it lost more than the initial max usage.
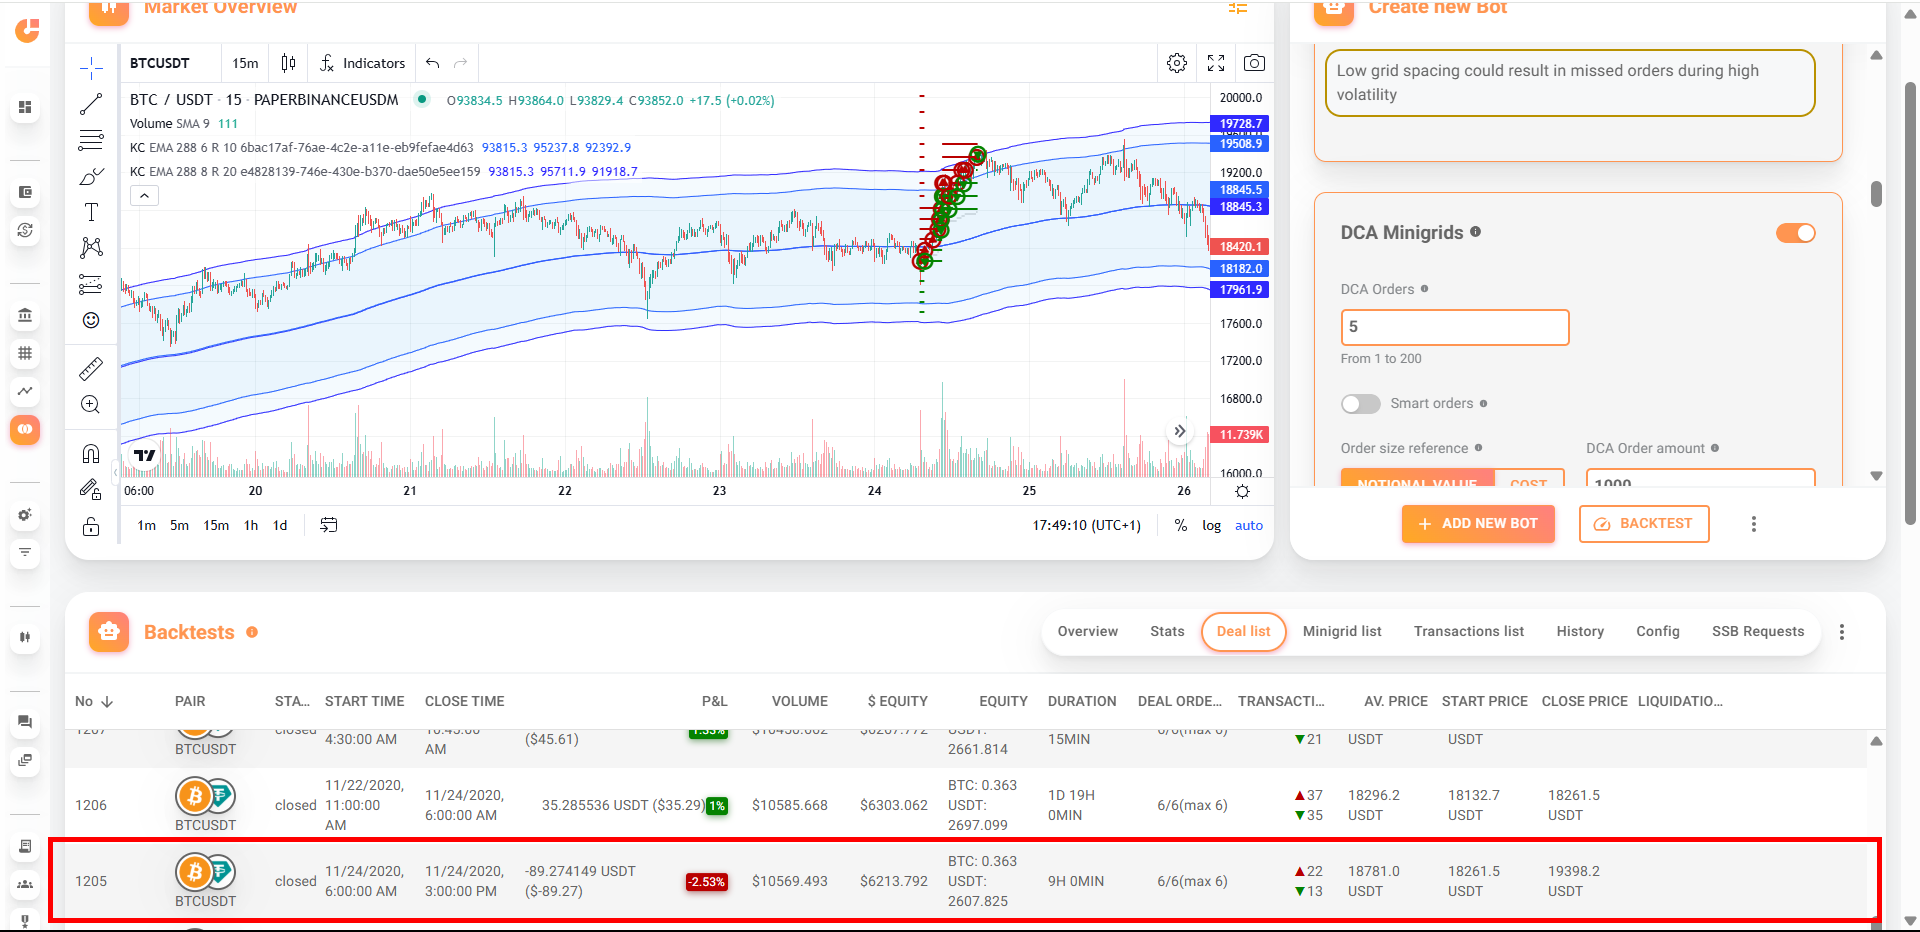
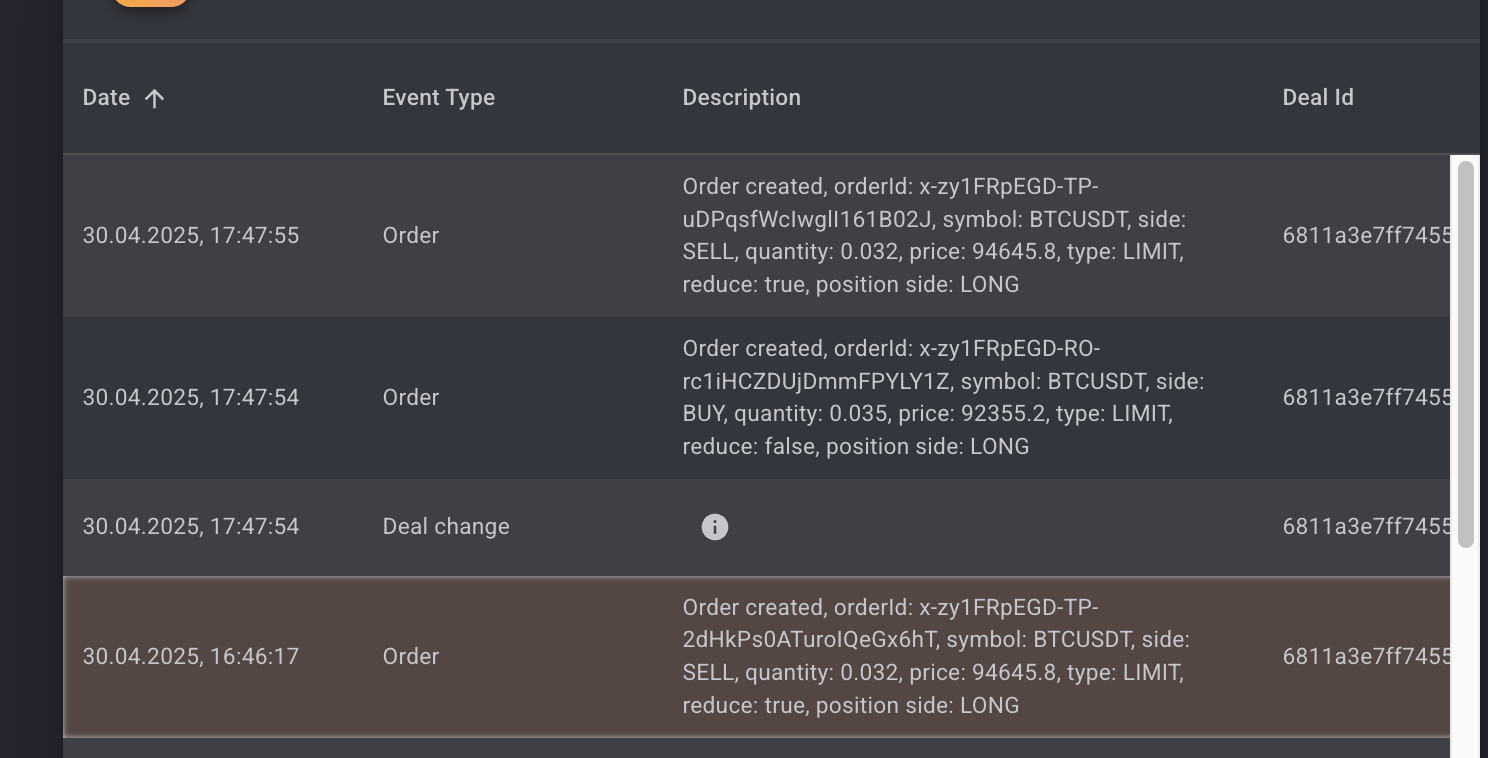
Thank you for the explanation @aressanch That is how I assumed it worked. But when I look at the trade list I can not see any evidence that this situation actually occurred with the backtest in question. Here is a snapshot of my screen, and I have highlighted the would-be problematic trade on the 24th Nov 2020.
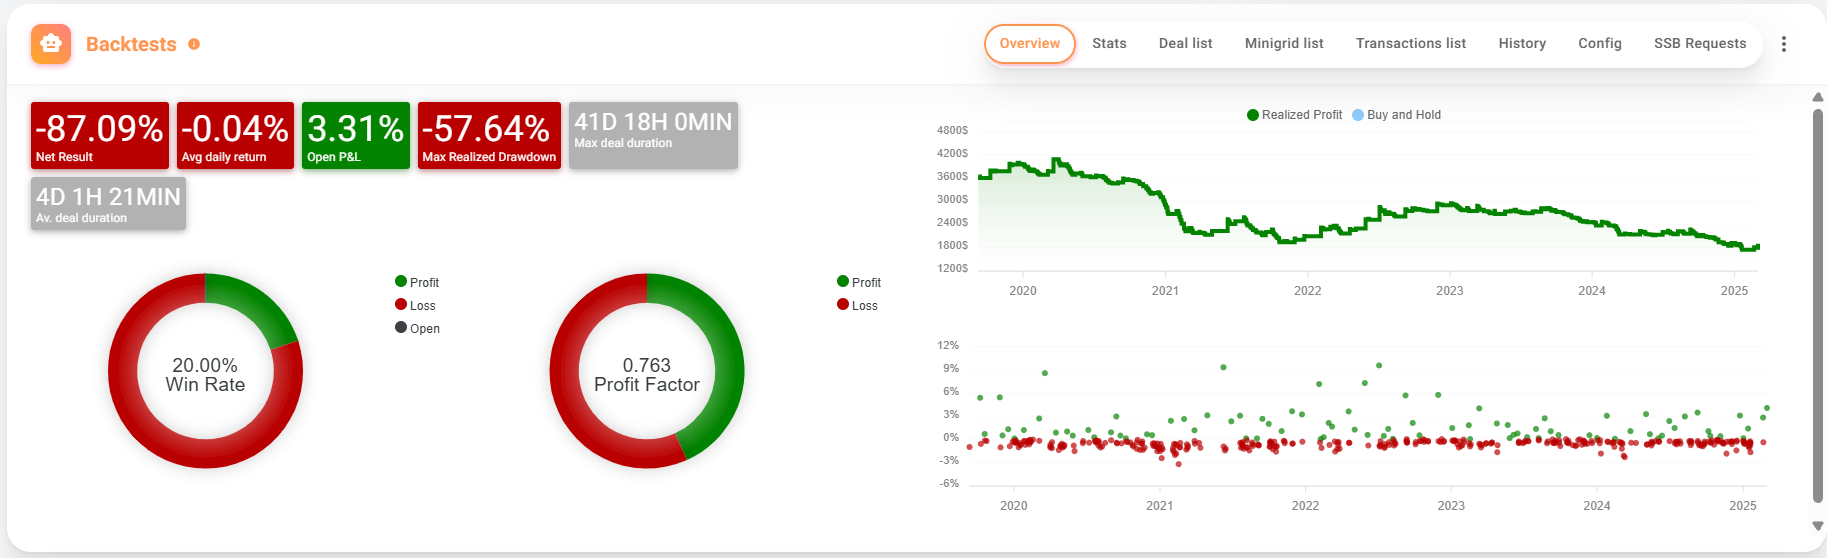
As you can see there is no cause for alarm as only a $89 loss was recorded (this is a short bot) with no erratic price behaviour. Yet in my bot stats as show in the second image of my first post the equity drawdown came to -$6512 (it would be really cool if there were links in the bot stats screen under “Max Realized DD” and “Max Equity DD” that takes us directly to these problematic areas in the Deal List. According to the time graph in the first image, this occurred on 24th November 2020 (but maybe this is incorrect? and the cause of my dilemma).
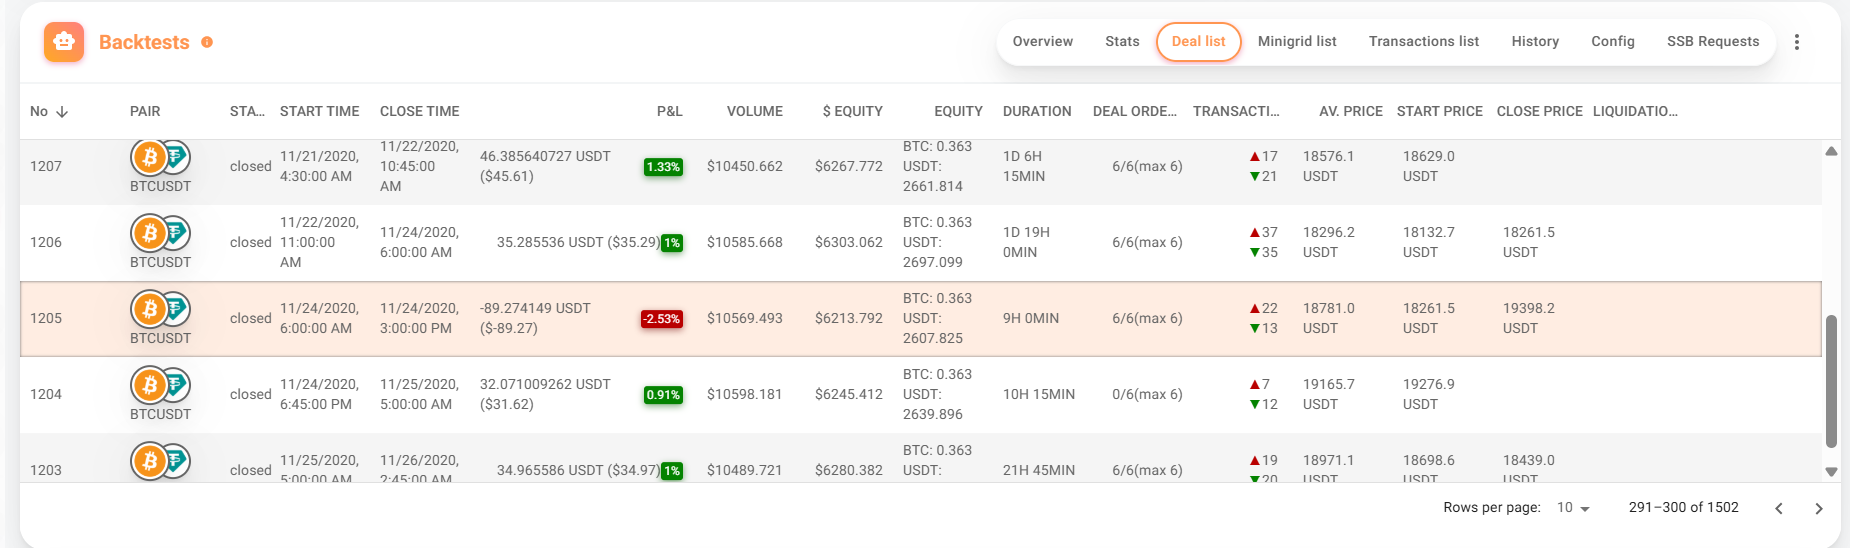
This bot only has one trade open at any time, and the trades on either side of this one spanning 21 to 25 Nov 2020 were all positive as you can see here:
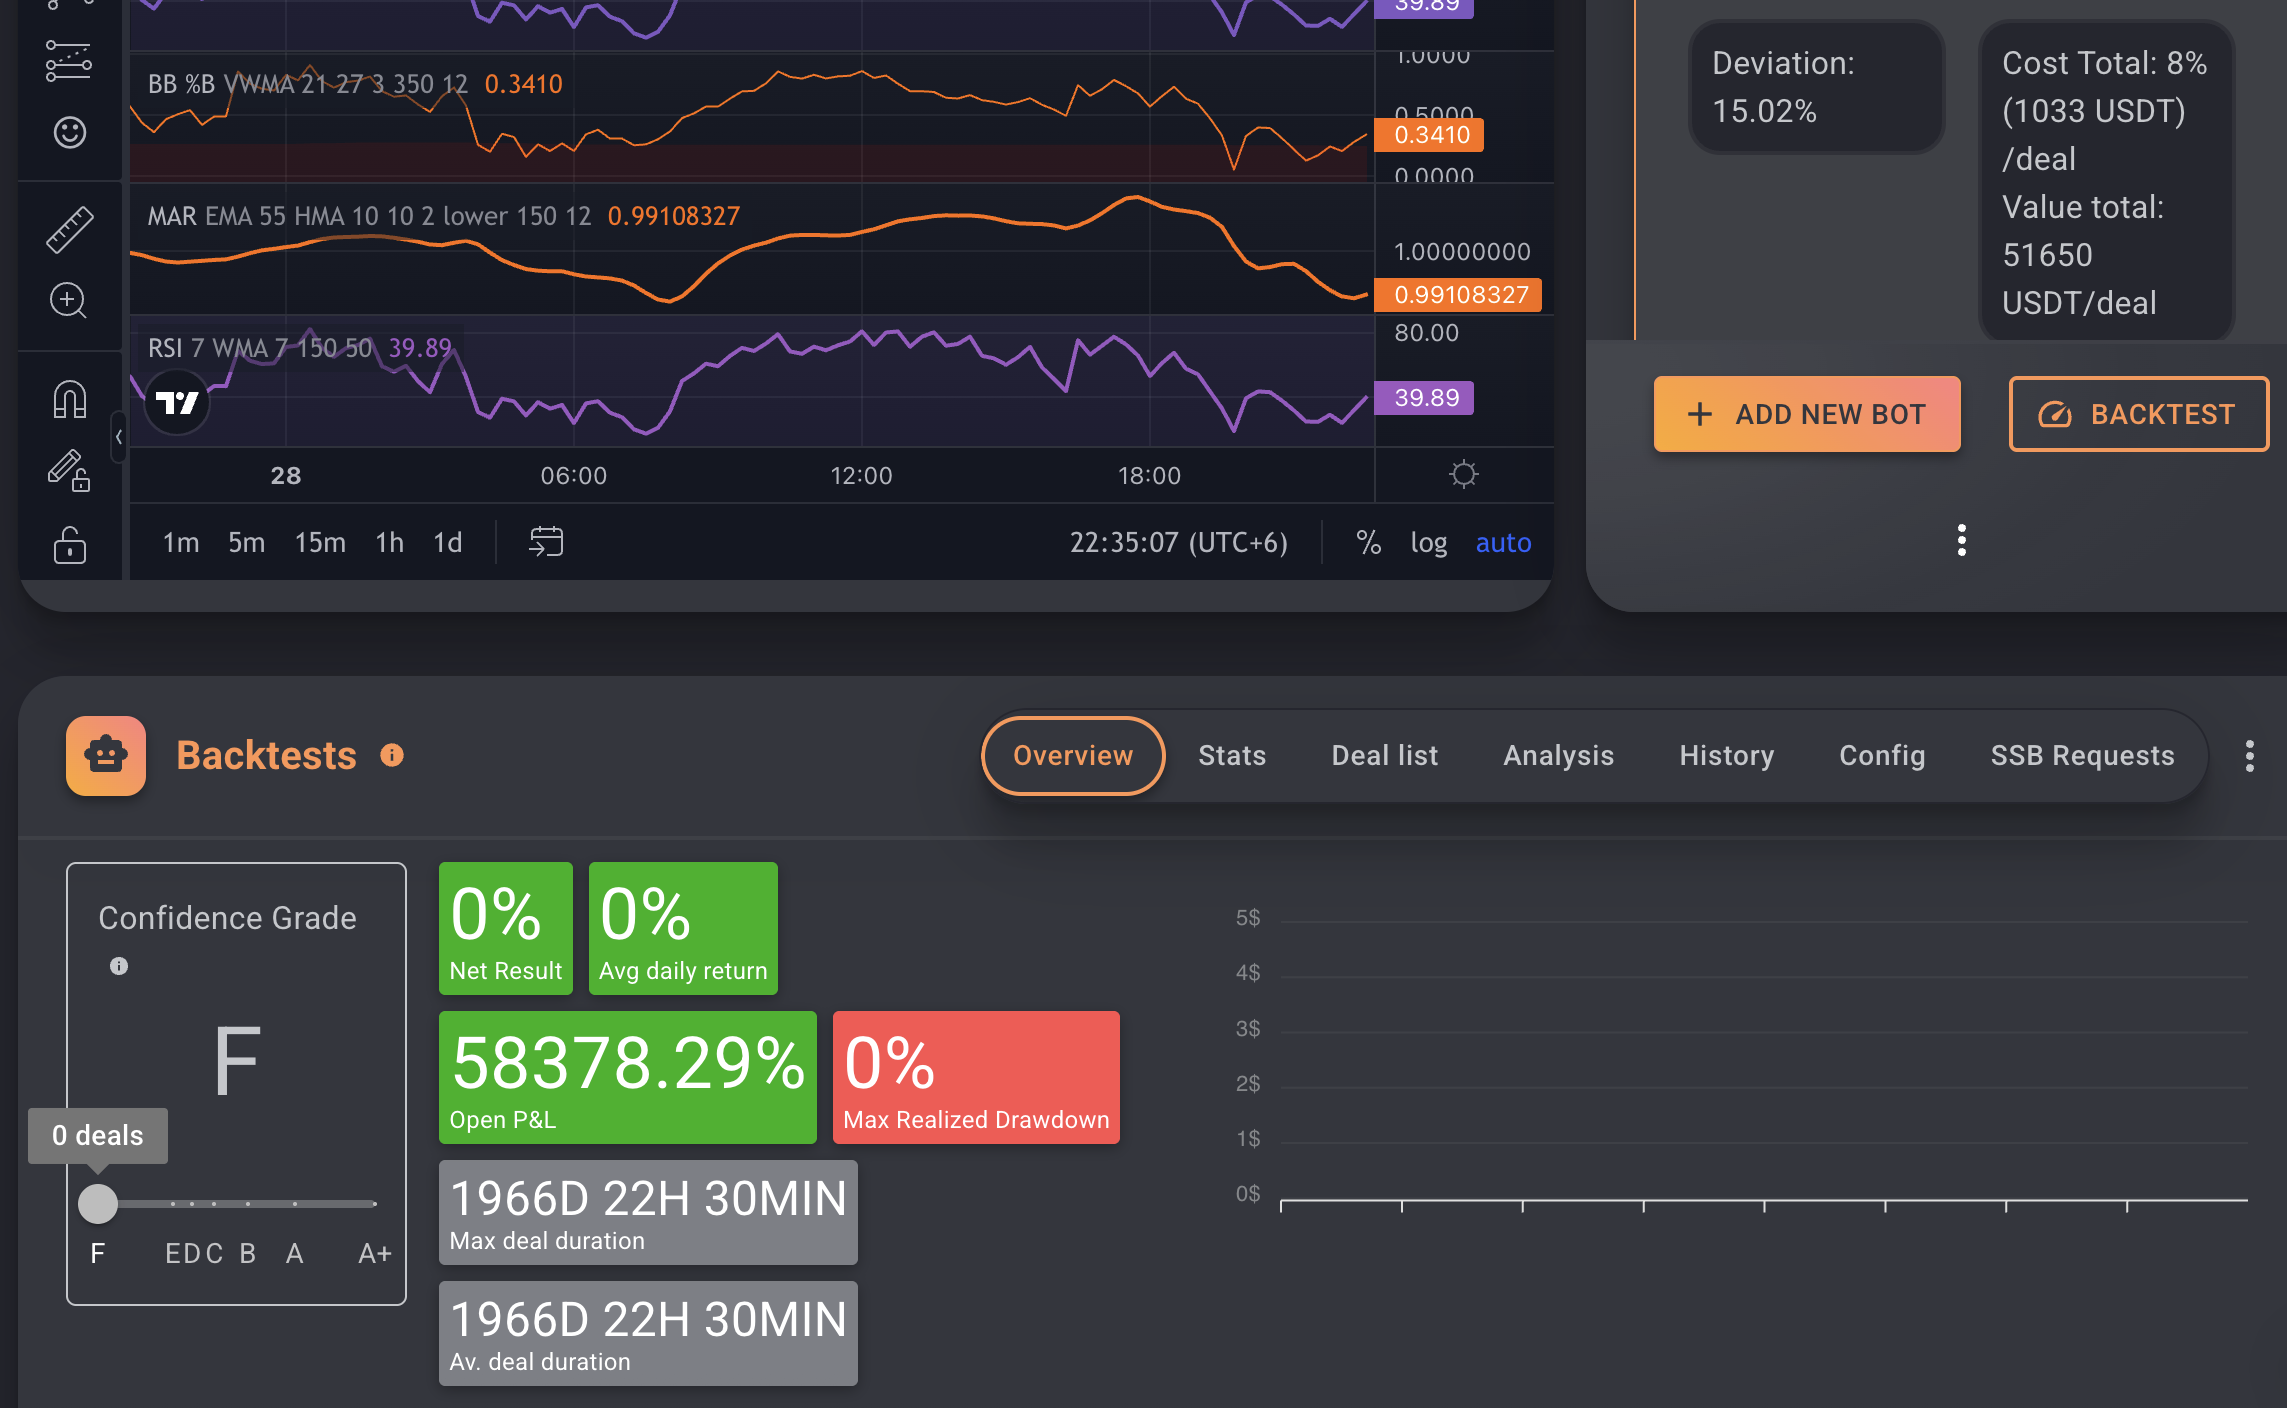
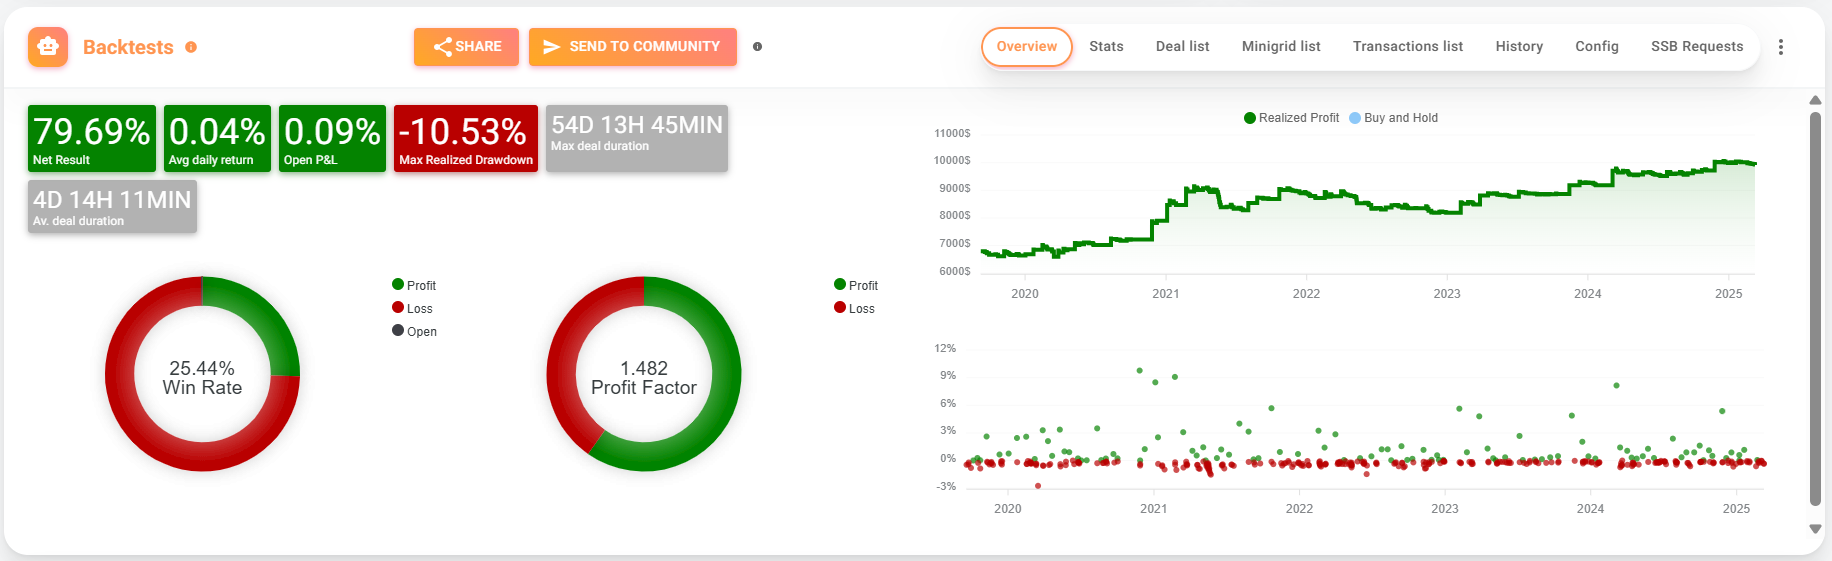
Hi @maksym.shamko - yeah the results are much different now except it seems the take profit component does not work. My bot is suppose to take profits at 1% as shown in image 1 above. However, if I now run the bot with the exact same settings and data it produces far fewer deals with profits significantly above 1% (see below). Can you pls check that the Take Profit function of the Combo bot is working as it did previously.
Hi guys. Are we sure the backtester for Combo on futures now works as it should?
Sometimes when I run it I get this weird result where the equity is not shown on the chart and the Take Profit function still does not work. I have Take Profit set to 1% yet the results show higher TPs and much fewer deals which means this setting is not adhered to.
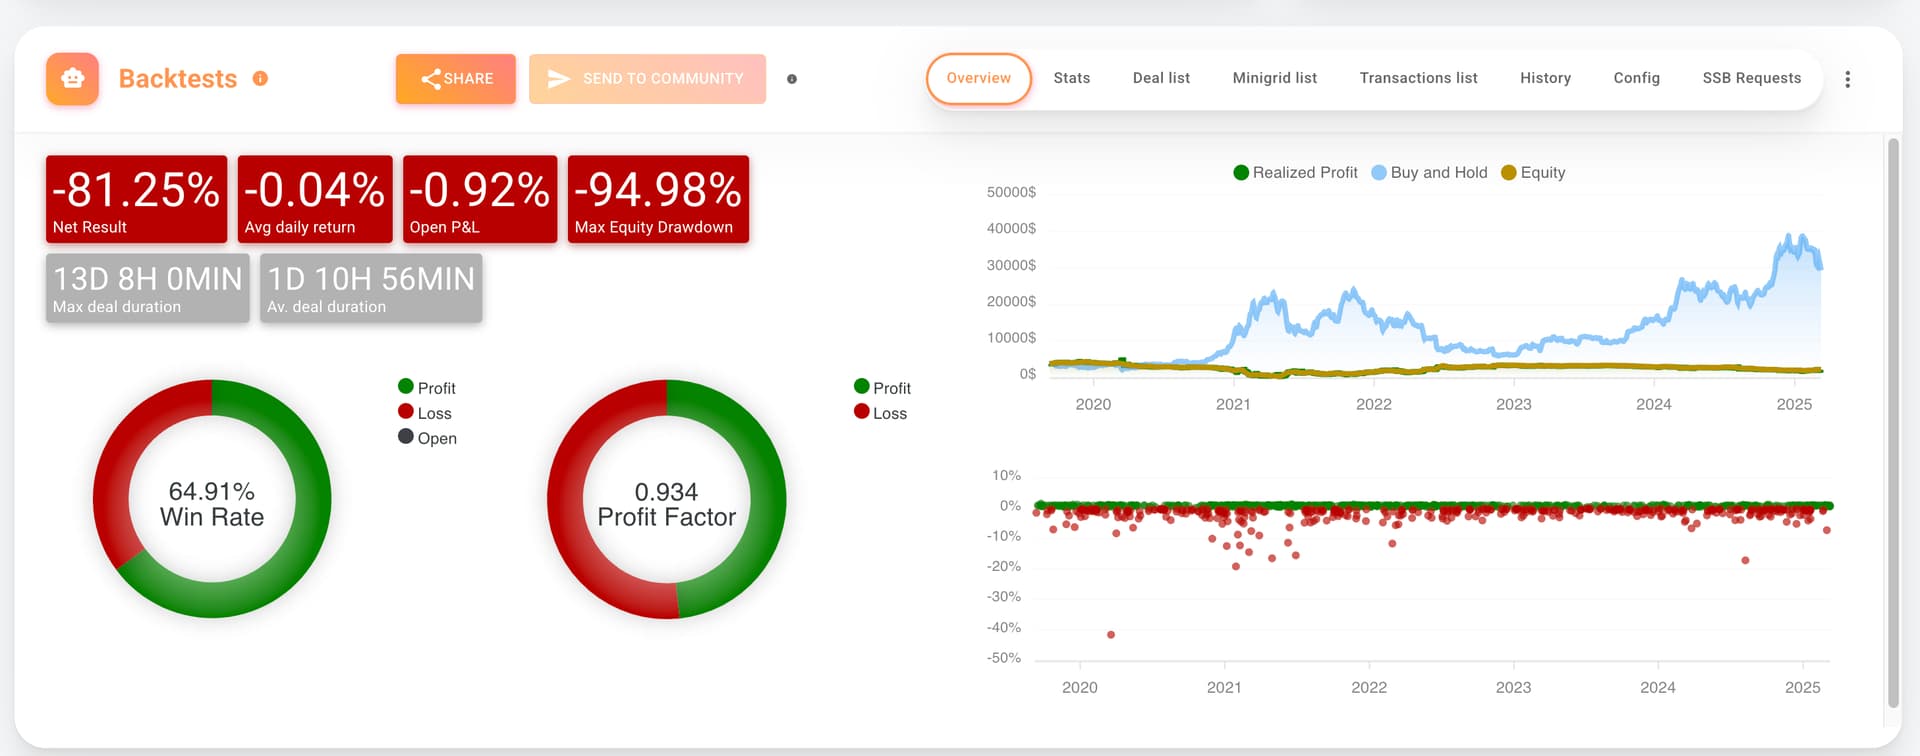
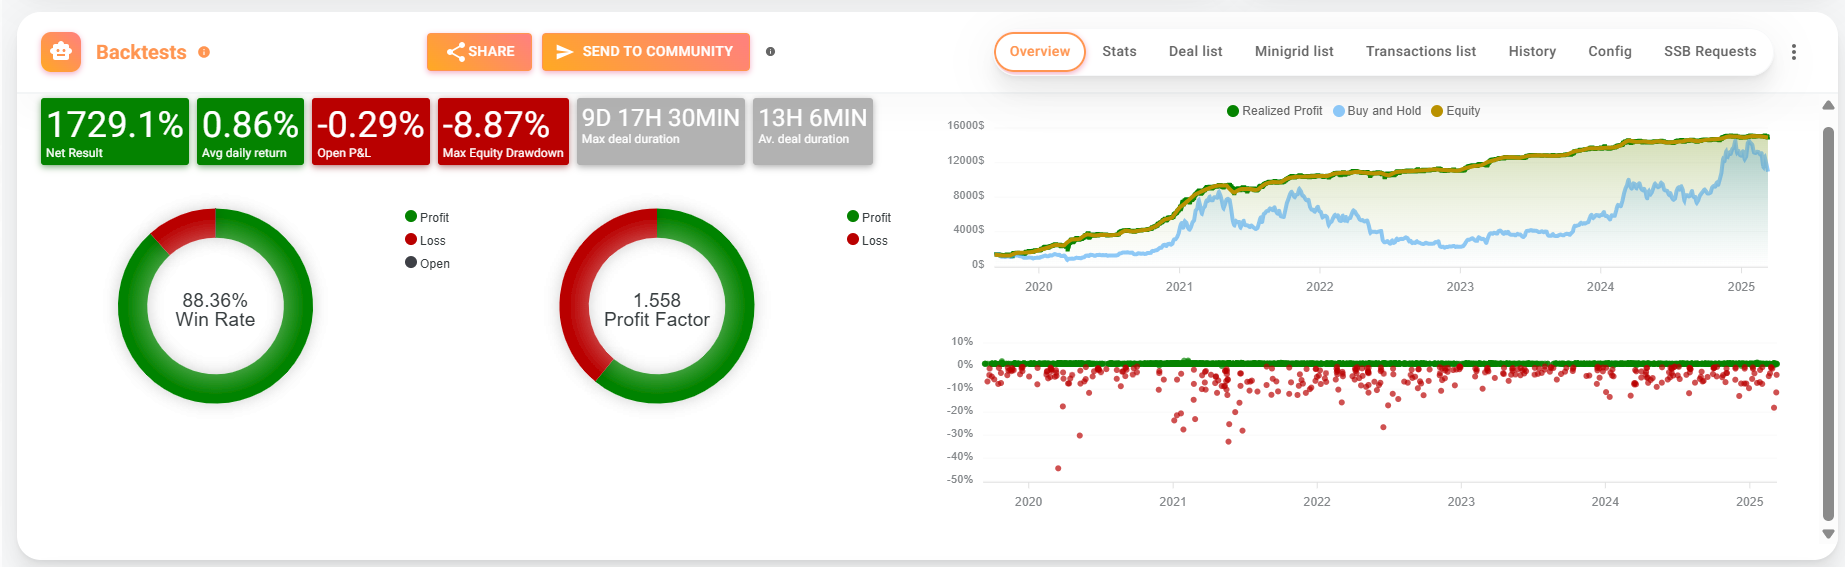
Other times it does work. Here is the exact same setting apart from the leverage being increased. Now the 1% Take Profit does work and the Equity line is shown? The only change I made was to move the leverage from 1x to 5x
now faced another issue, the bot did not place TP automatically. This can be very costly error. Please check the error. I had to manually edit & place TP (%age based limit order).