As you may have already noticed, we have one new indicator in our arsenal: the Market Structure. Developing this was reasonably complex, but I am pretty happy with the result and potential applications.
This indicator is a mashup of indicators I found in Tradingview, from which I picked different ideas. The most important thing to notice is that it doesn’t look as nice as other pivot high/low indicators such as this one:
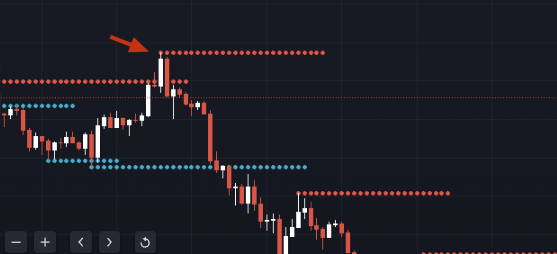
And the reason for that is repainting. Indicators that repaint are dangerous, it often gives the illusion that produce great signals. In the indicator above, you may be tempted to think that you could have used a condition for crossing up the line to stop your trade, for example, without realizing that then, we didn’t know that was a higher high, it took a few more bars to confirm, and that’s the reason you see a gap in the one we developed.
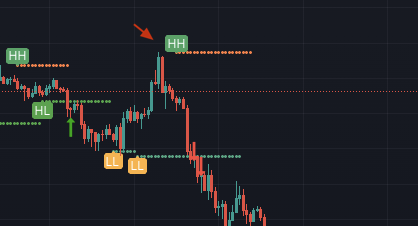
So, with that said, I started experimenting and found a promising strategy that could be used as a backbone for further development. If you saw my videos, you may remember the process I generally follow. The first step is to generate a trading hypothesis, and I hypothesize that when crossing up the first Higher Low, we are in an uptrend and should go long. We can then place our TP as crossing up the next Higher High, and as a SL, we can use crossing down a Lower Low.
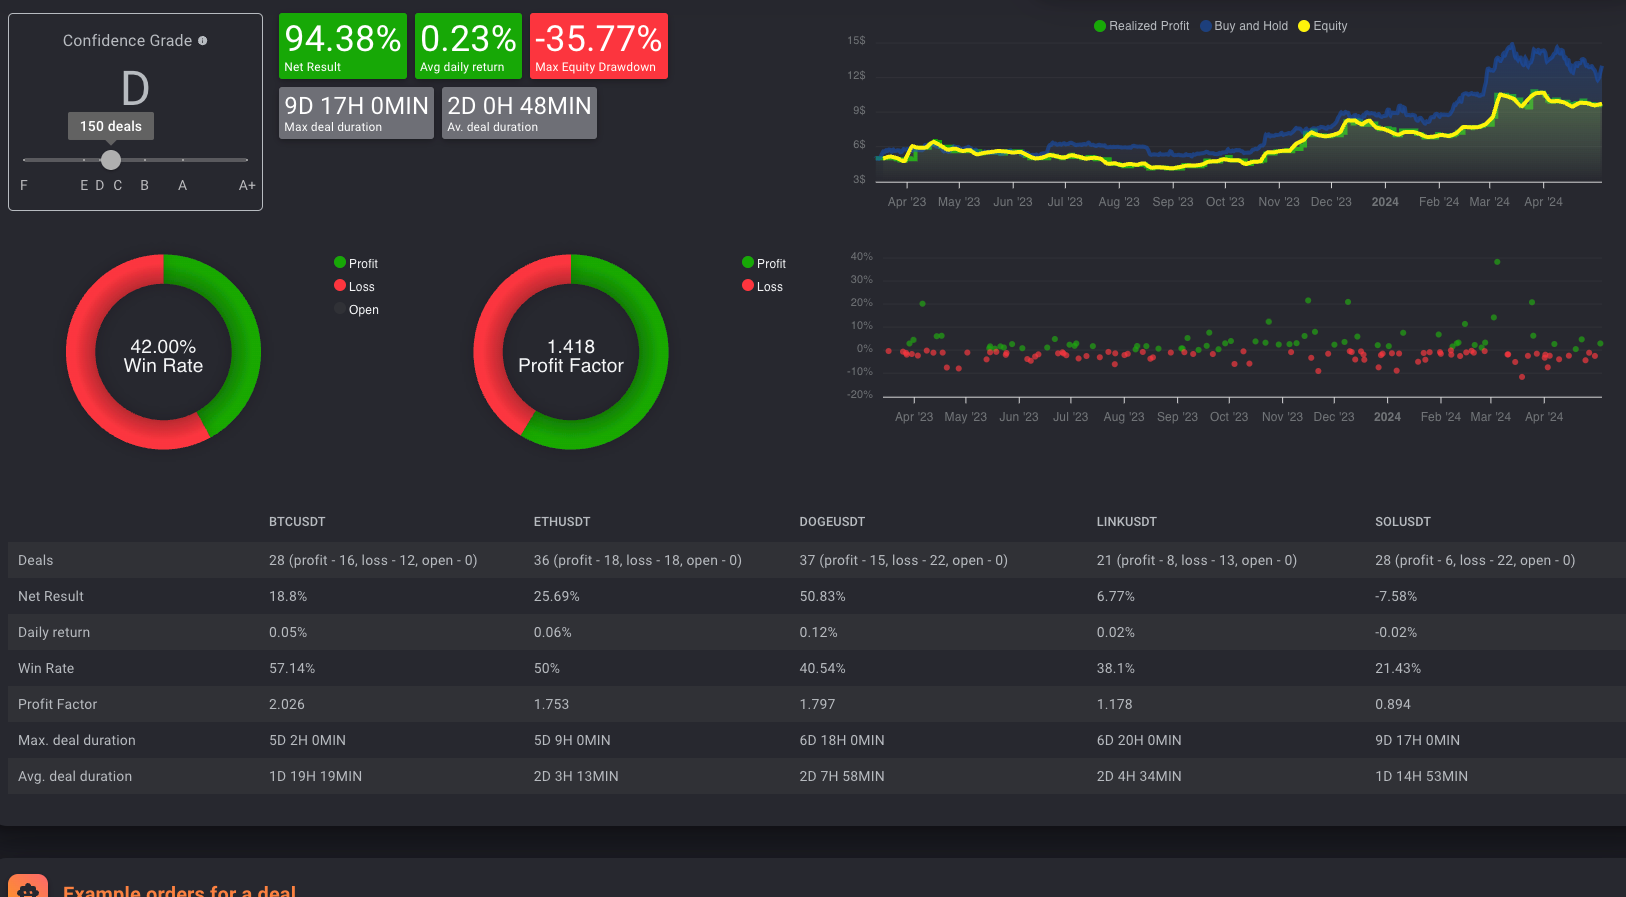
And voila, we have a profitable strategy → Link
With the last couple of strategies, I continued experimenting by myself. But this time, I thought continuing the conversation in the open would be much more productive and fun.
So what do you say? Do you want to help me find some good settings? Go ahead and let me know in the comments what you find. As we develop the strategy, I will edit the original post with the findings.
Some ideas for improvement:
- Using higher timeframe confirmation filters (supertrend, moving averages, etc)
- Adding more coins to the mix
- Examining the biggest losers, can we avoid them?