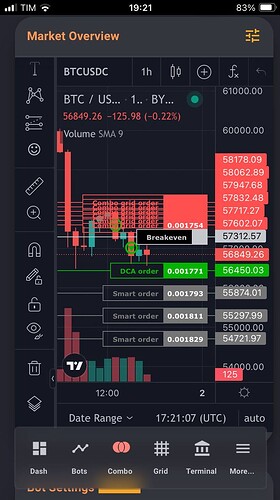
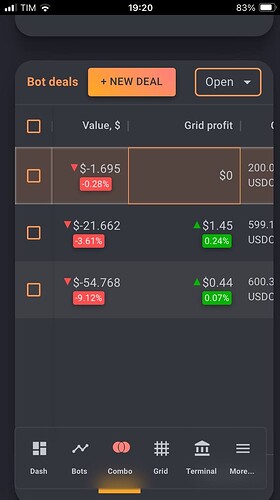
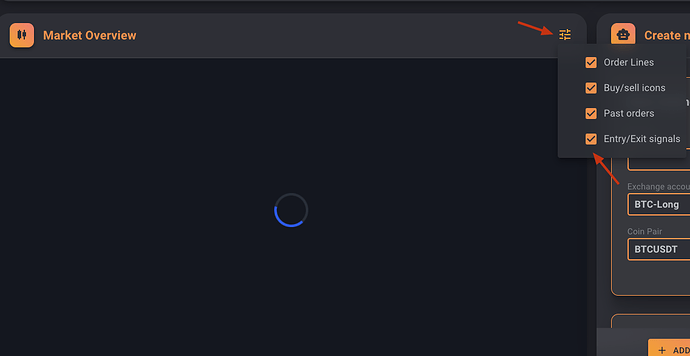
Is there a way to show all simultaneous opened deals on the chart at the same time? Maybe a button as it was in the past will be great ![]()
Or maybe we could choose which deals to view simultaneously?
It could also be an option if the feature allows to mark those deals we want to display.
I’m always mindful of building features in layers so we breakdown the process in small added features making them easier to implement - take for example conditional DCA or dynamic price for simultaneous deals we can keep building useful features for the community on top of the base ![]()
What would make more sense for me is to display all deals that are in view of the chart, for which we need to get the current view X-axis and determine what period is the graph showing. @maksym.shamko can confirm if this is possible.
Then we could add the option in chart menu “Show all deals”
Chart X-axis has minimum scale, it means that we might be not able show desired period in one chart view. Instead it can be moved to first deal start time.
There is a reason why we do not show all deals on chart. Is because single deal can have so much icons and lines to show on chart (buy/sell icons, order lines, SL, lines, multiple TP/SL lines etc.). Showing them all together can create a mess on chart. Especially in combo bots.
Would it be possible to make a simplified version maybe just showing an overview of all simultaneous deals in grey with only the base and DCAs (like when we have no active smart orders as an indication) and leave only the selected deal active with all coloured lines and deals icon - this way we can have an idea of what range with a covering with our bot - then if you want to investigate a deal in details you still need to select the deal in the bottom menu
Not trying to make it difficult just making useful - if you think it’s still too complicated then move on ![]() we can live without
we can live without ![]()


