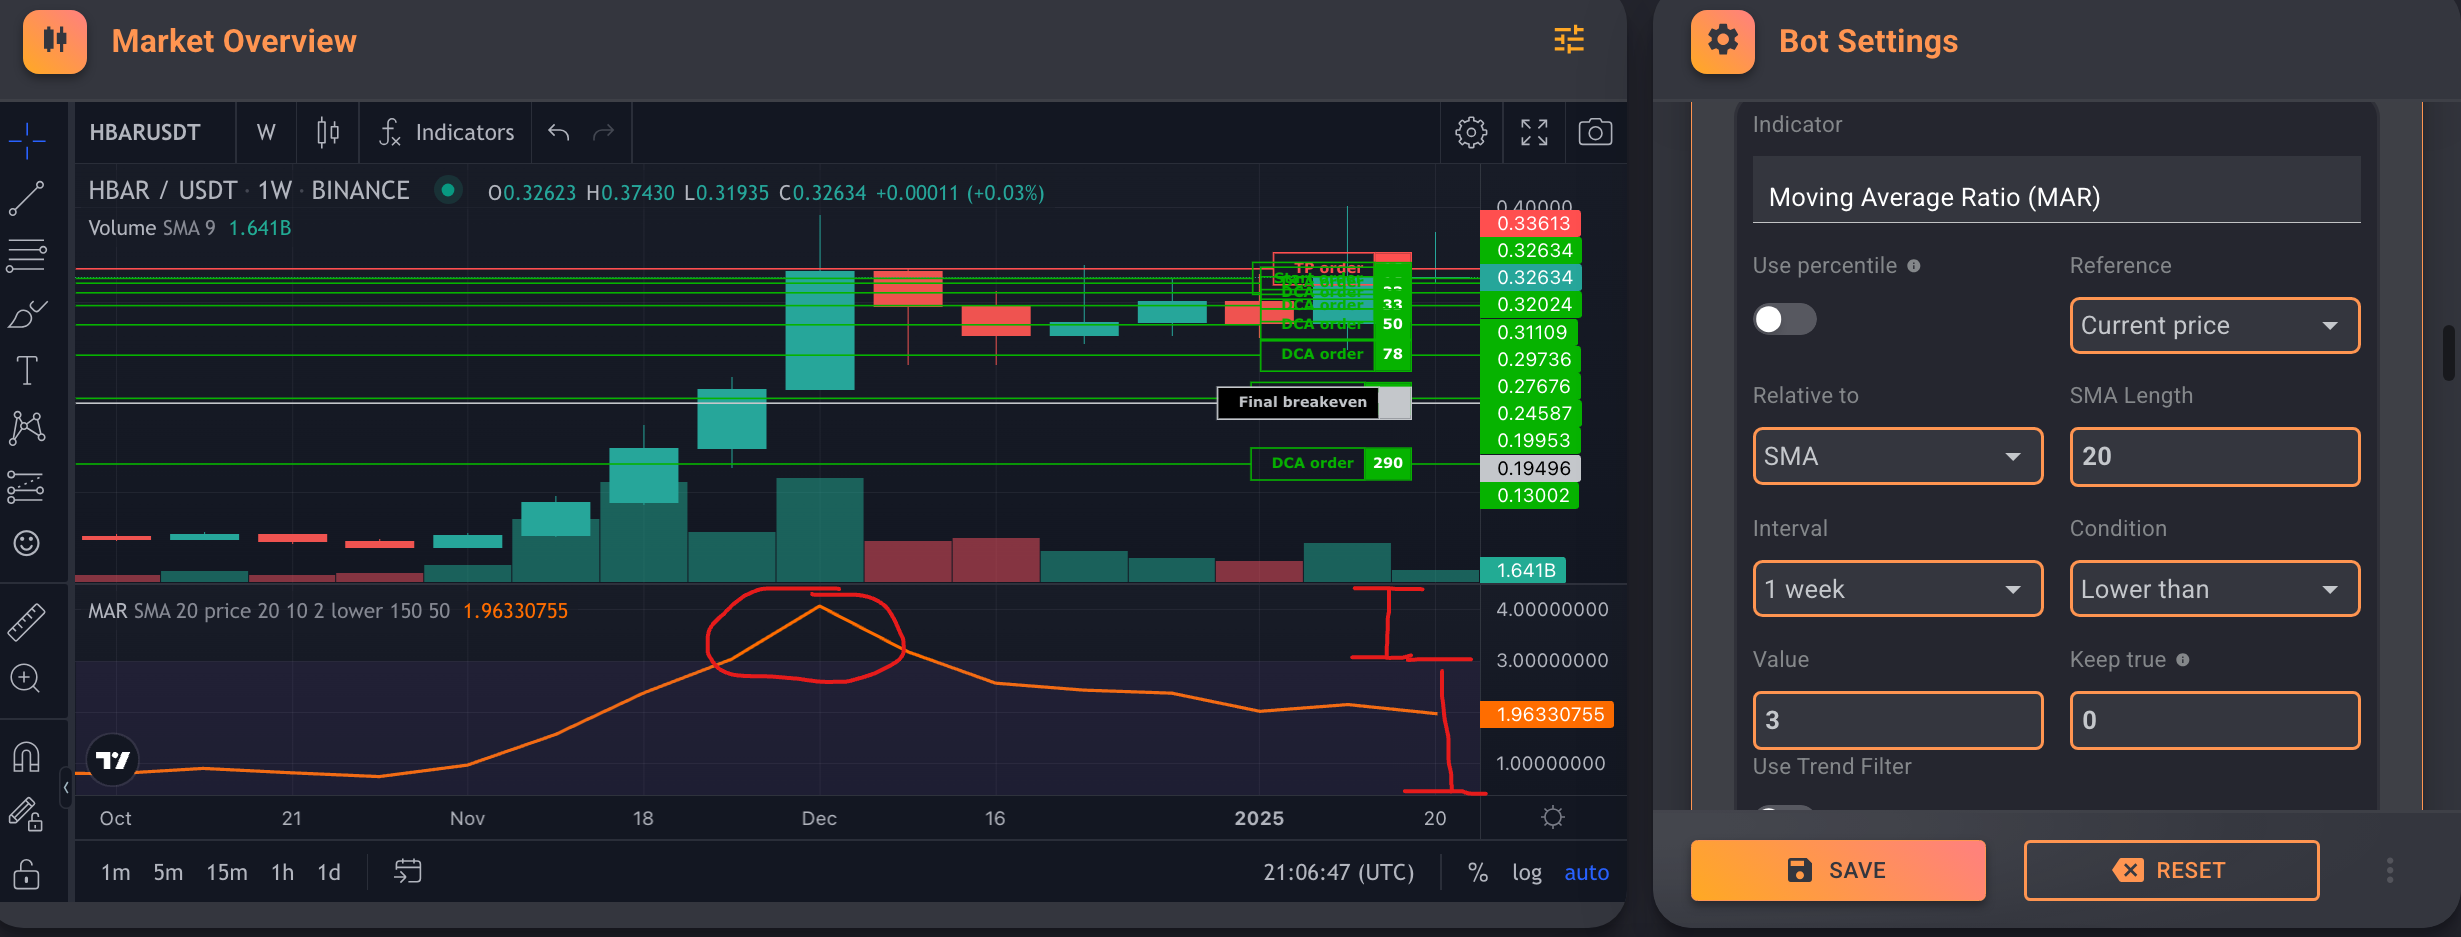
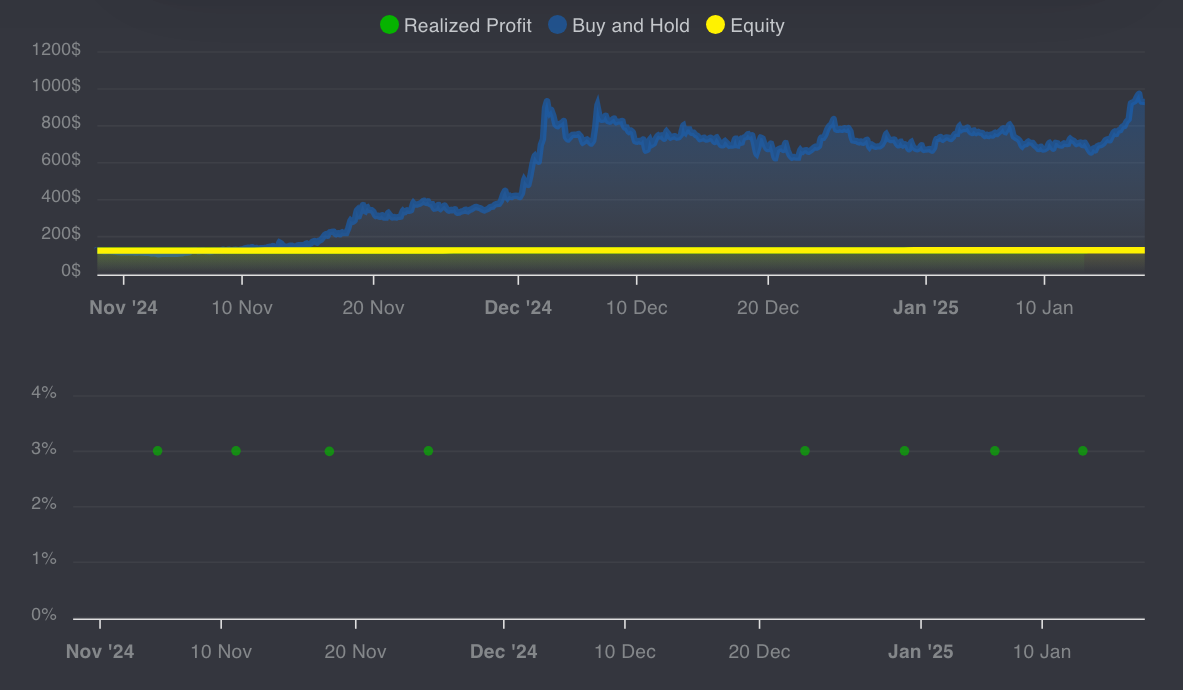
So with “lower” than “3” you can see that mid December the peak of MAR 20w SMA is outside the opaque area. And that seems to align around the time that a deal wasn’t opened (see deal chart below).
I think this means that I do want lower, but the value is not a %. I don’t get the scale, but that’s fine I can visualise it. But what doesn’t make sense is why the deals only happened once per week. The condition interval for the indicator is weekly, but I want deals opens to be evaluate as soon as the previous deal closes.
Oh you’re right, I was thinking the HMAR is like the ATH.
MAR: price/weekly MA. So if the price is above the MA, it must be over 1. So if the price is $10 and the MA value is $5, MAR is 2. So in the graph you can see the value of MA (add the MA indicator in addition to MAR) then take any point in price and with the measurement see which value is 60% decline. Divide that price / that MA value and the result is the value you need to enter, then higher than.
Ok that makes sense. But what about only opening 1 deal per week? When I look at the deals list I can see there’s gaps between the deals of days. It seems the indicator only fires once per candle which is weekly.
For that you will need a lower time frame indicator that is always true like rsi<100. You can do it on the daily if you want one deal per day at max.
1 Like
Ok that’s not going to work for me. I want ASAP that is governed by right now measured against the most recent BMSB (last week candle is fine).
Do you think it’s possible to have a gated ASAP deal evaluation that uses the previous week’s 20w SMA and or 21w EMA?
It’s possible ASAP + indicators. Though I’m not sure how to display in the UI in a simple way. You can create the feature request for it.
I guess I can work out the visualisation with what I’ve got above, then when I have the value I want I can switch to ASAP + indicators.
So couple of questions:
- how do I create the deal start condition as ASAP + indicators?
- how do I make the indicator look at last week’s 20w SMA?
I think you’re missing the bigger picture. This is a weekly average, which means it takes one week to print a new value. Does it mean you should enter a trade Monday at 12:00? Probably not. Find an hourly indicator for a more refined entry and use them in combination for best results. Then it should do what you’re after.
No it’s exactly what I want. A look back at the most recent 20w moving average, and that’s because the 20w SMA and 21w EMA are extremely slow moving averages.
I currently run ASAP, and this gets caught out by pumps. If the price is ticking along the BMSB (from last week’s data) or a little bit above or below, that’s all fine. If the price suddenly pumps up over minutes, hours, days, a week… it’s all the same. It’s TOO FAST. The idea is to only open deals when price isn’t suddenly pumping unexpectedly over a sub week timeframe.
Regardless of whether you don’t believe it is the indicator I should use, that’s my problem. I just want to know how to do it on Gainium if possible. Let me try it, test it, fail/succeed and report back to the community.