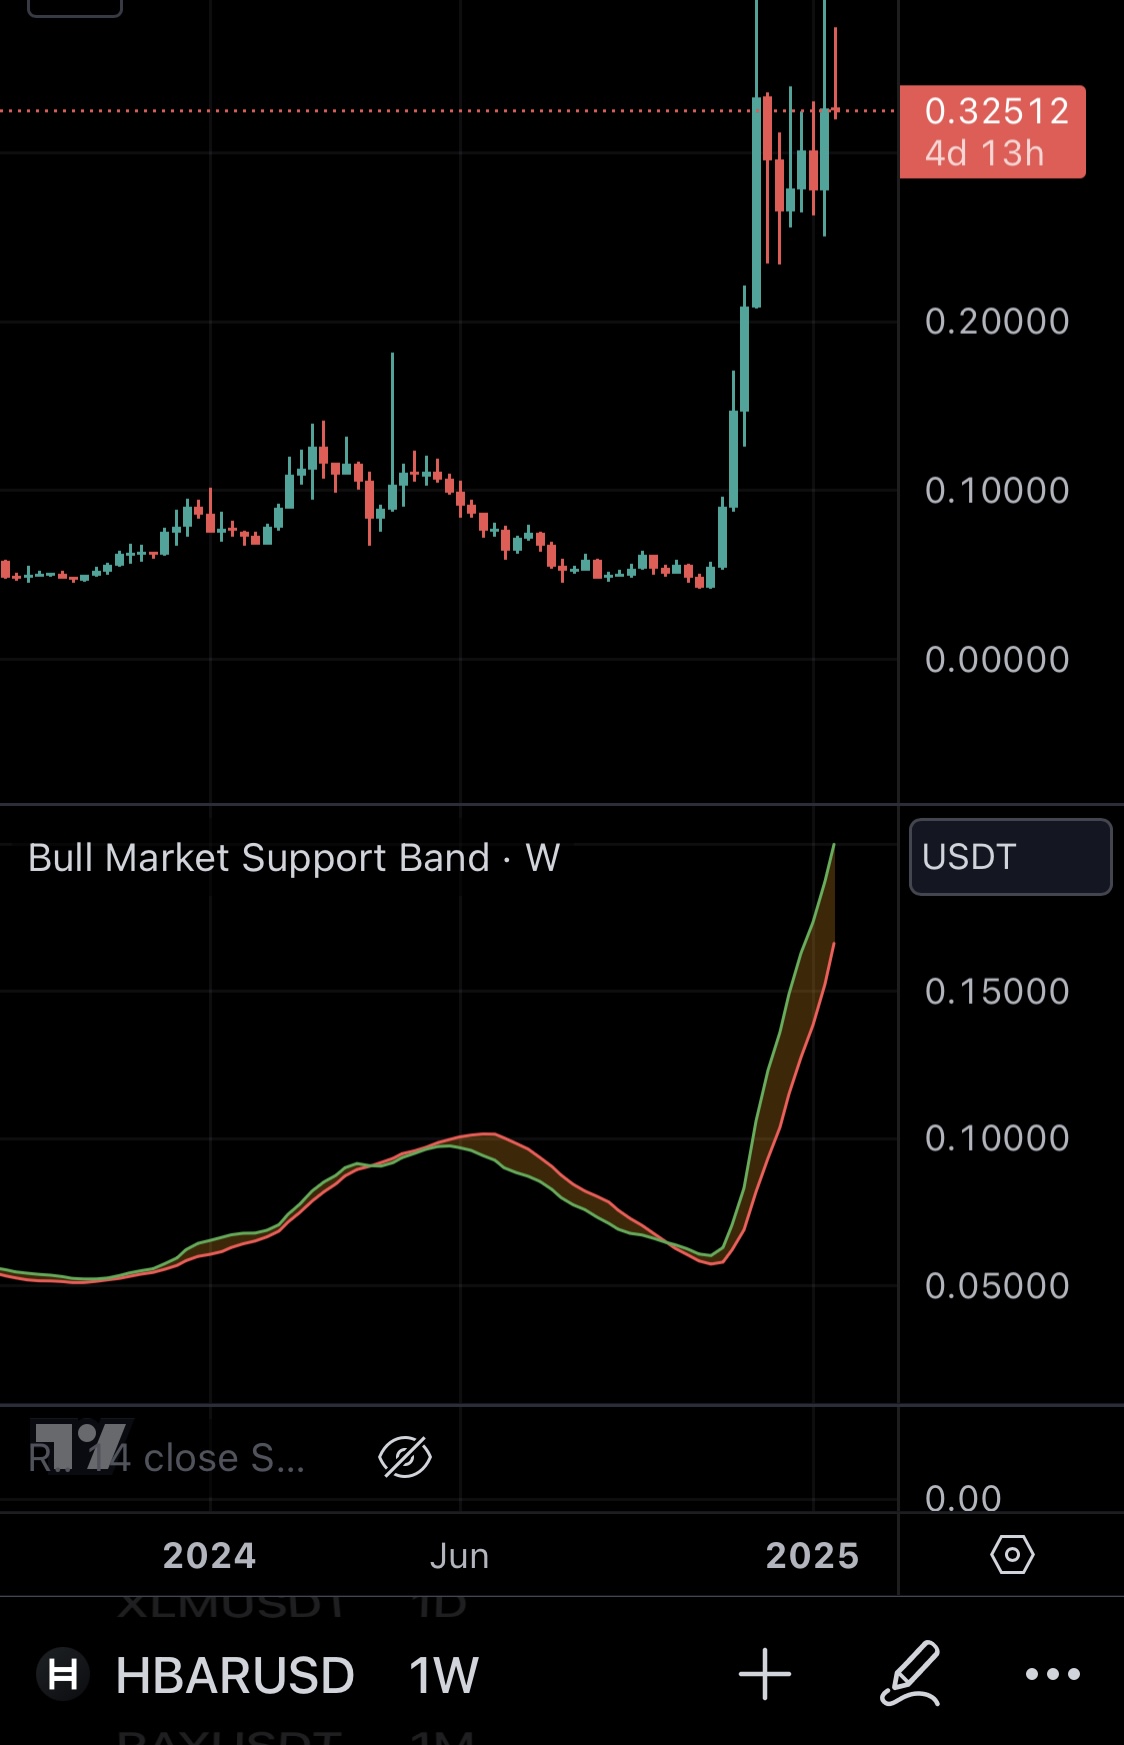
Been looking back at some of my stuck DCA deals (I run ASAP) and was wondering if there’s a way to tie the start condition to the Bull Market Support band.
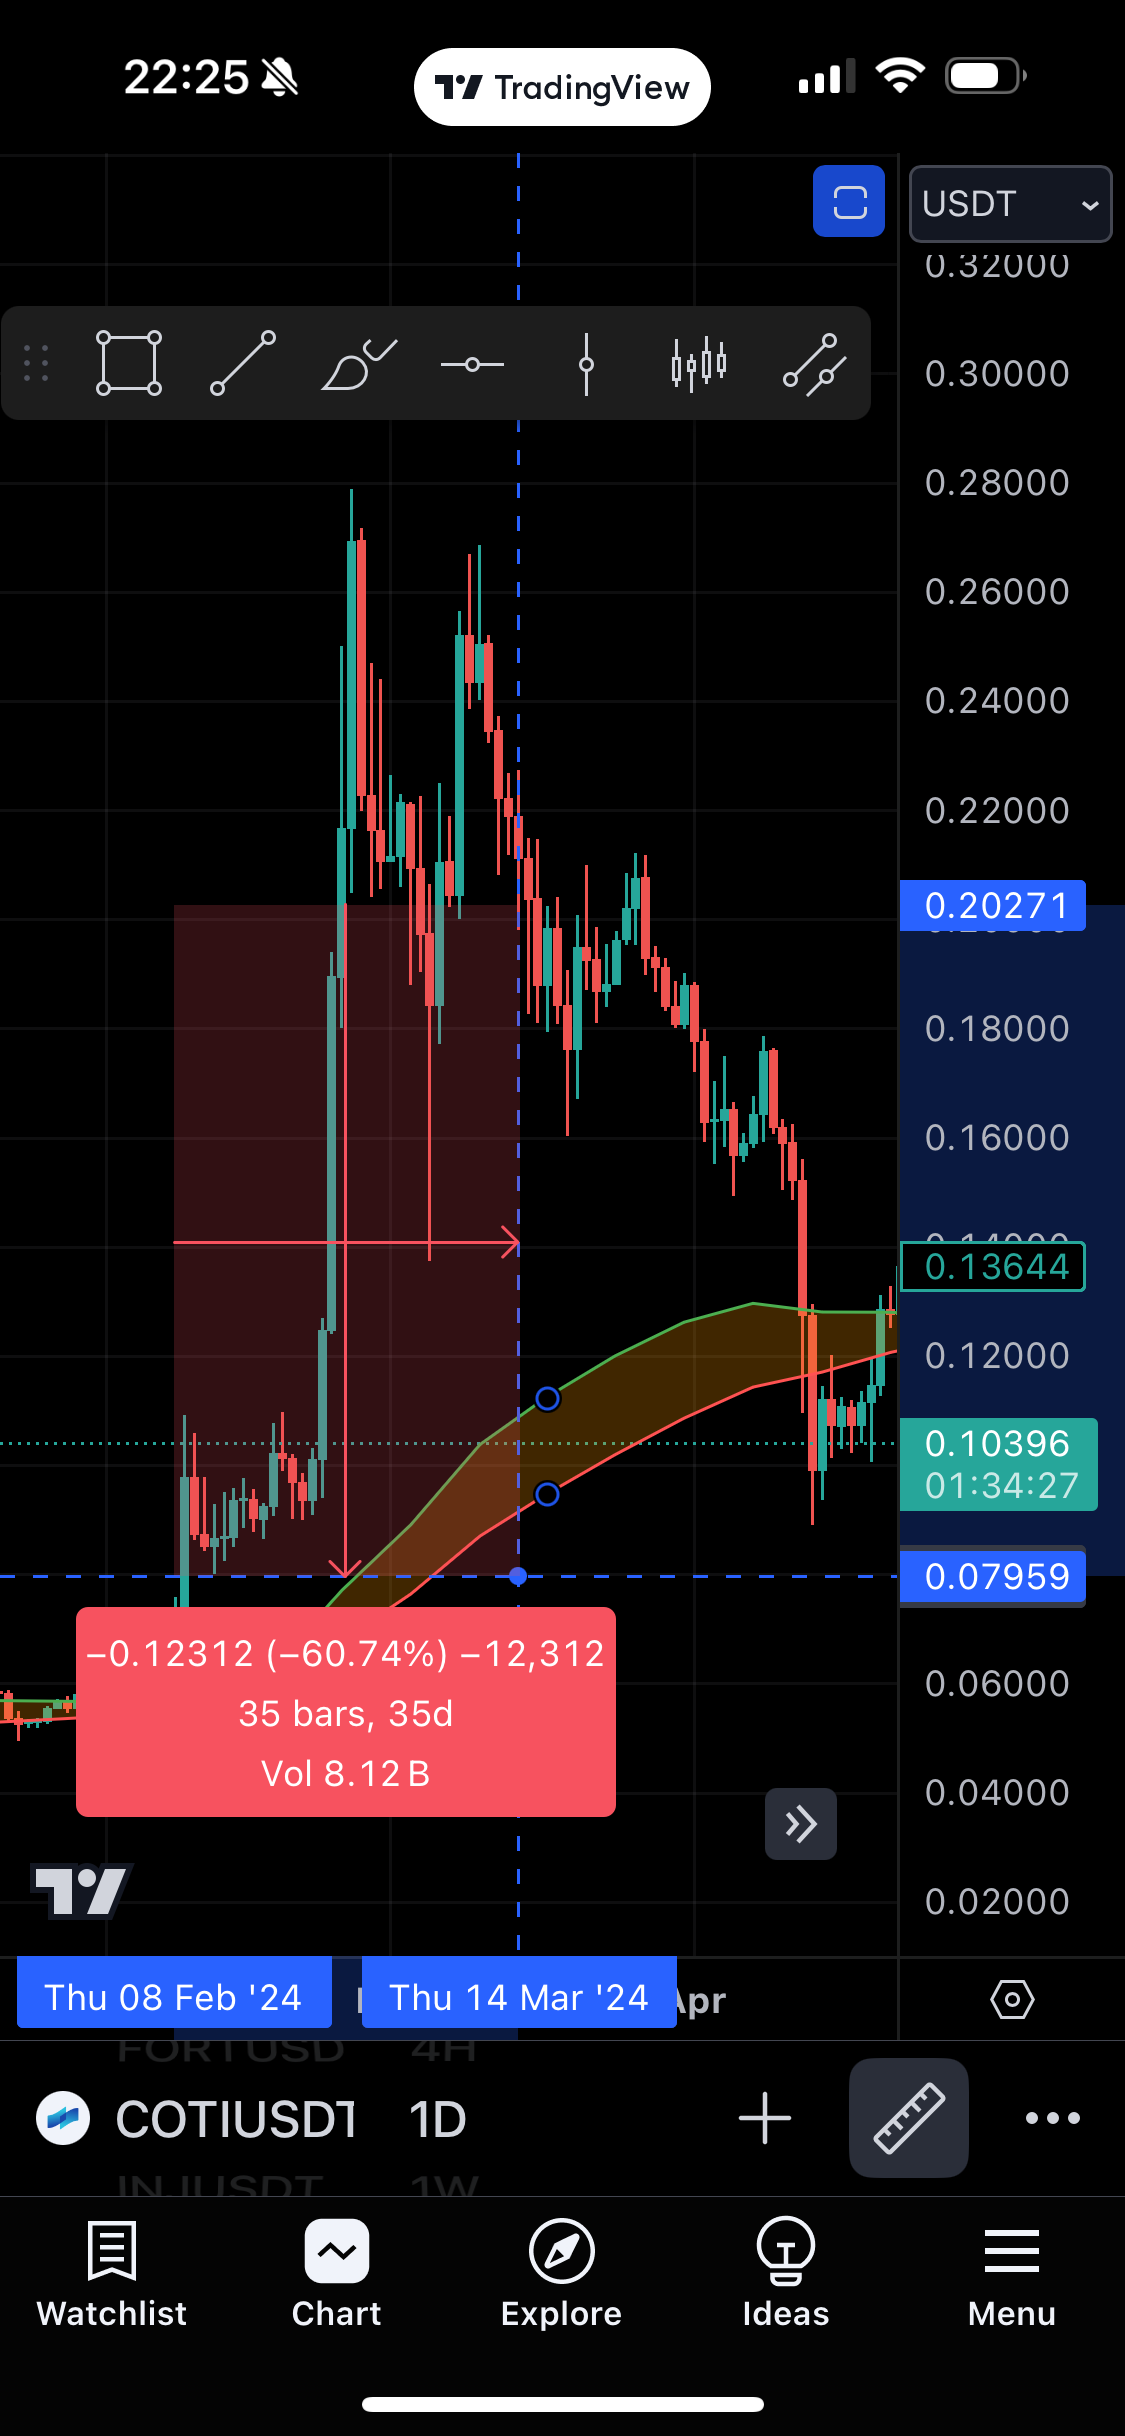
I generally remove a pair if it has moved up so that it is more than a 60% drop to the BMSB. That’s been useful for a lot of pumping coins but I’d like to automate it.
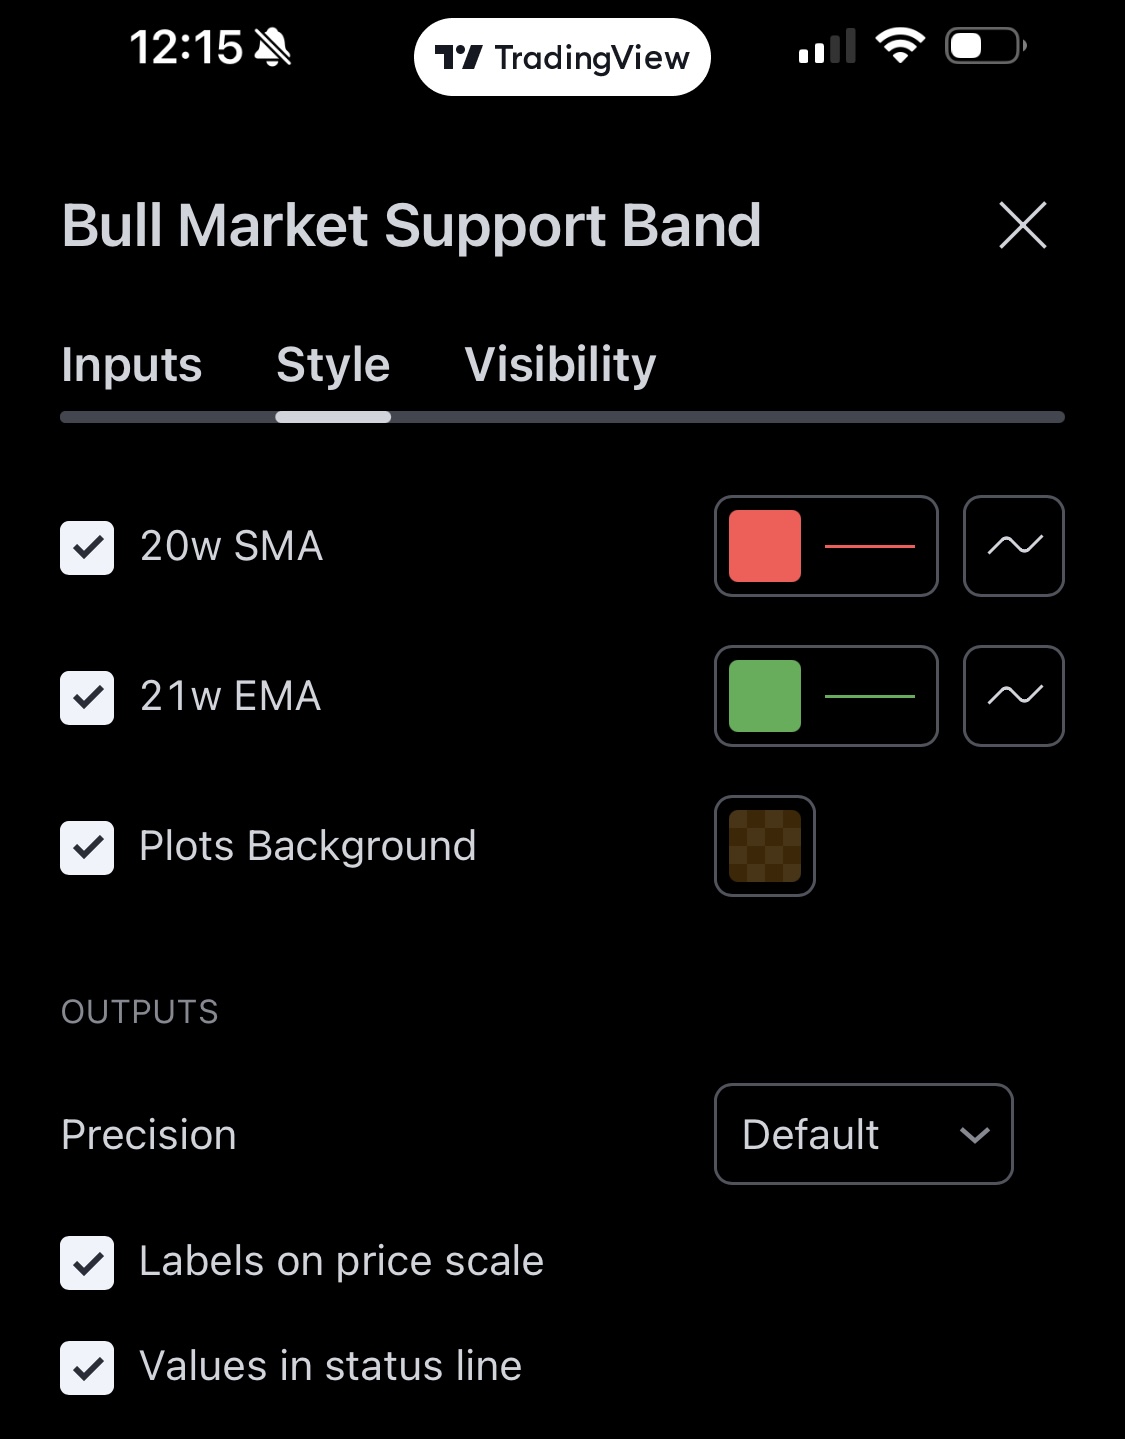
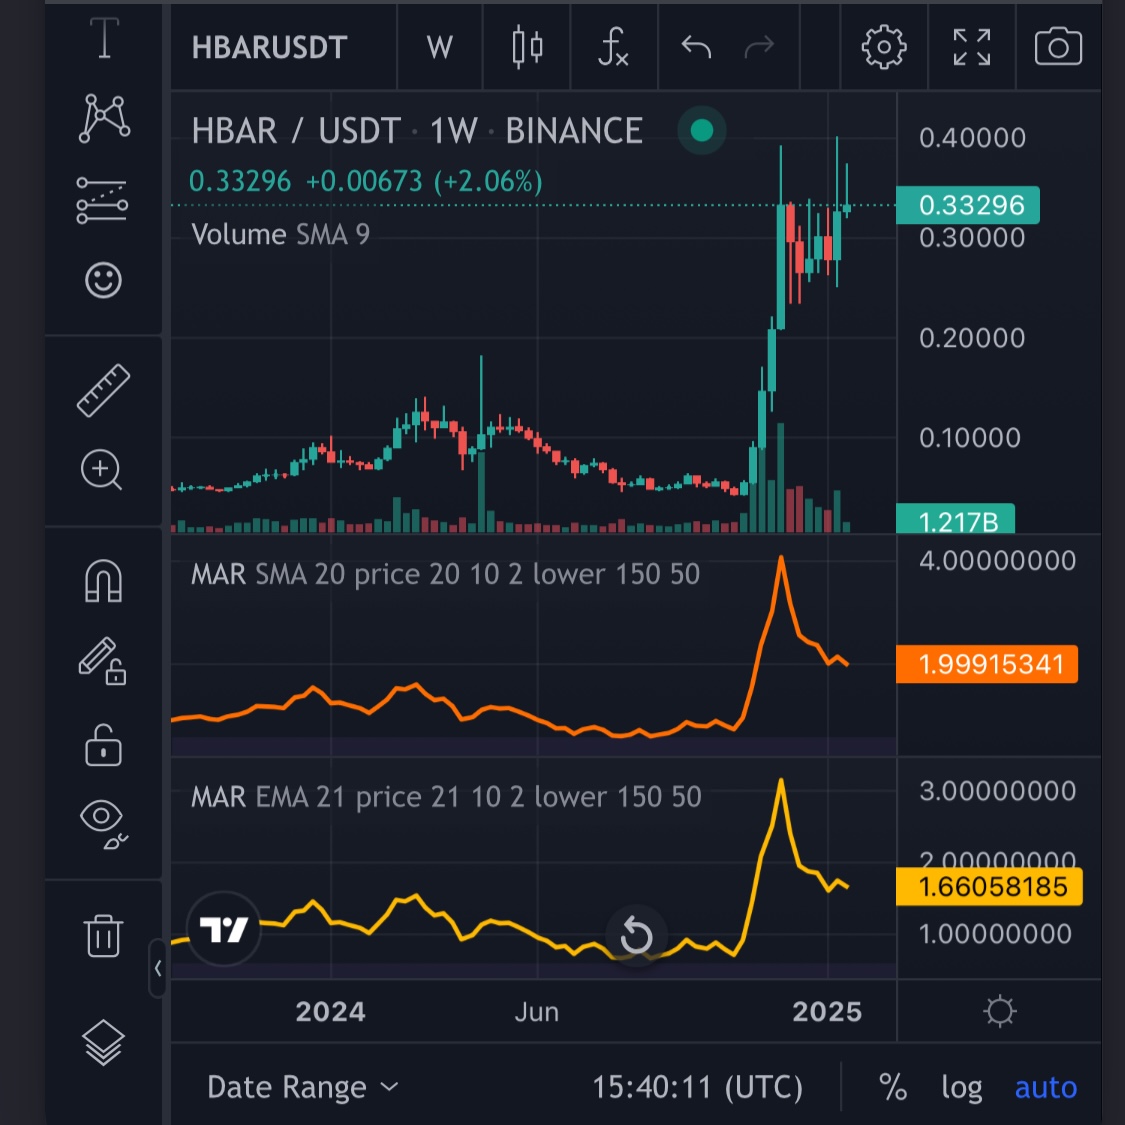
The green line represents the 20 weeks simple moving average and the red line represents the 21 weeks exponential moving average. The best way to read the current value is to look at the weekly chart, but any time frame will display the same values.
Still puzzling over this. So the BMSB is 20w SMA and 21W EMA. Together they make the band above.
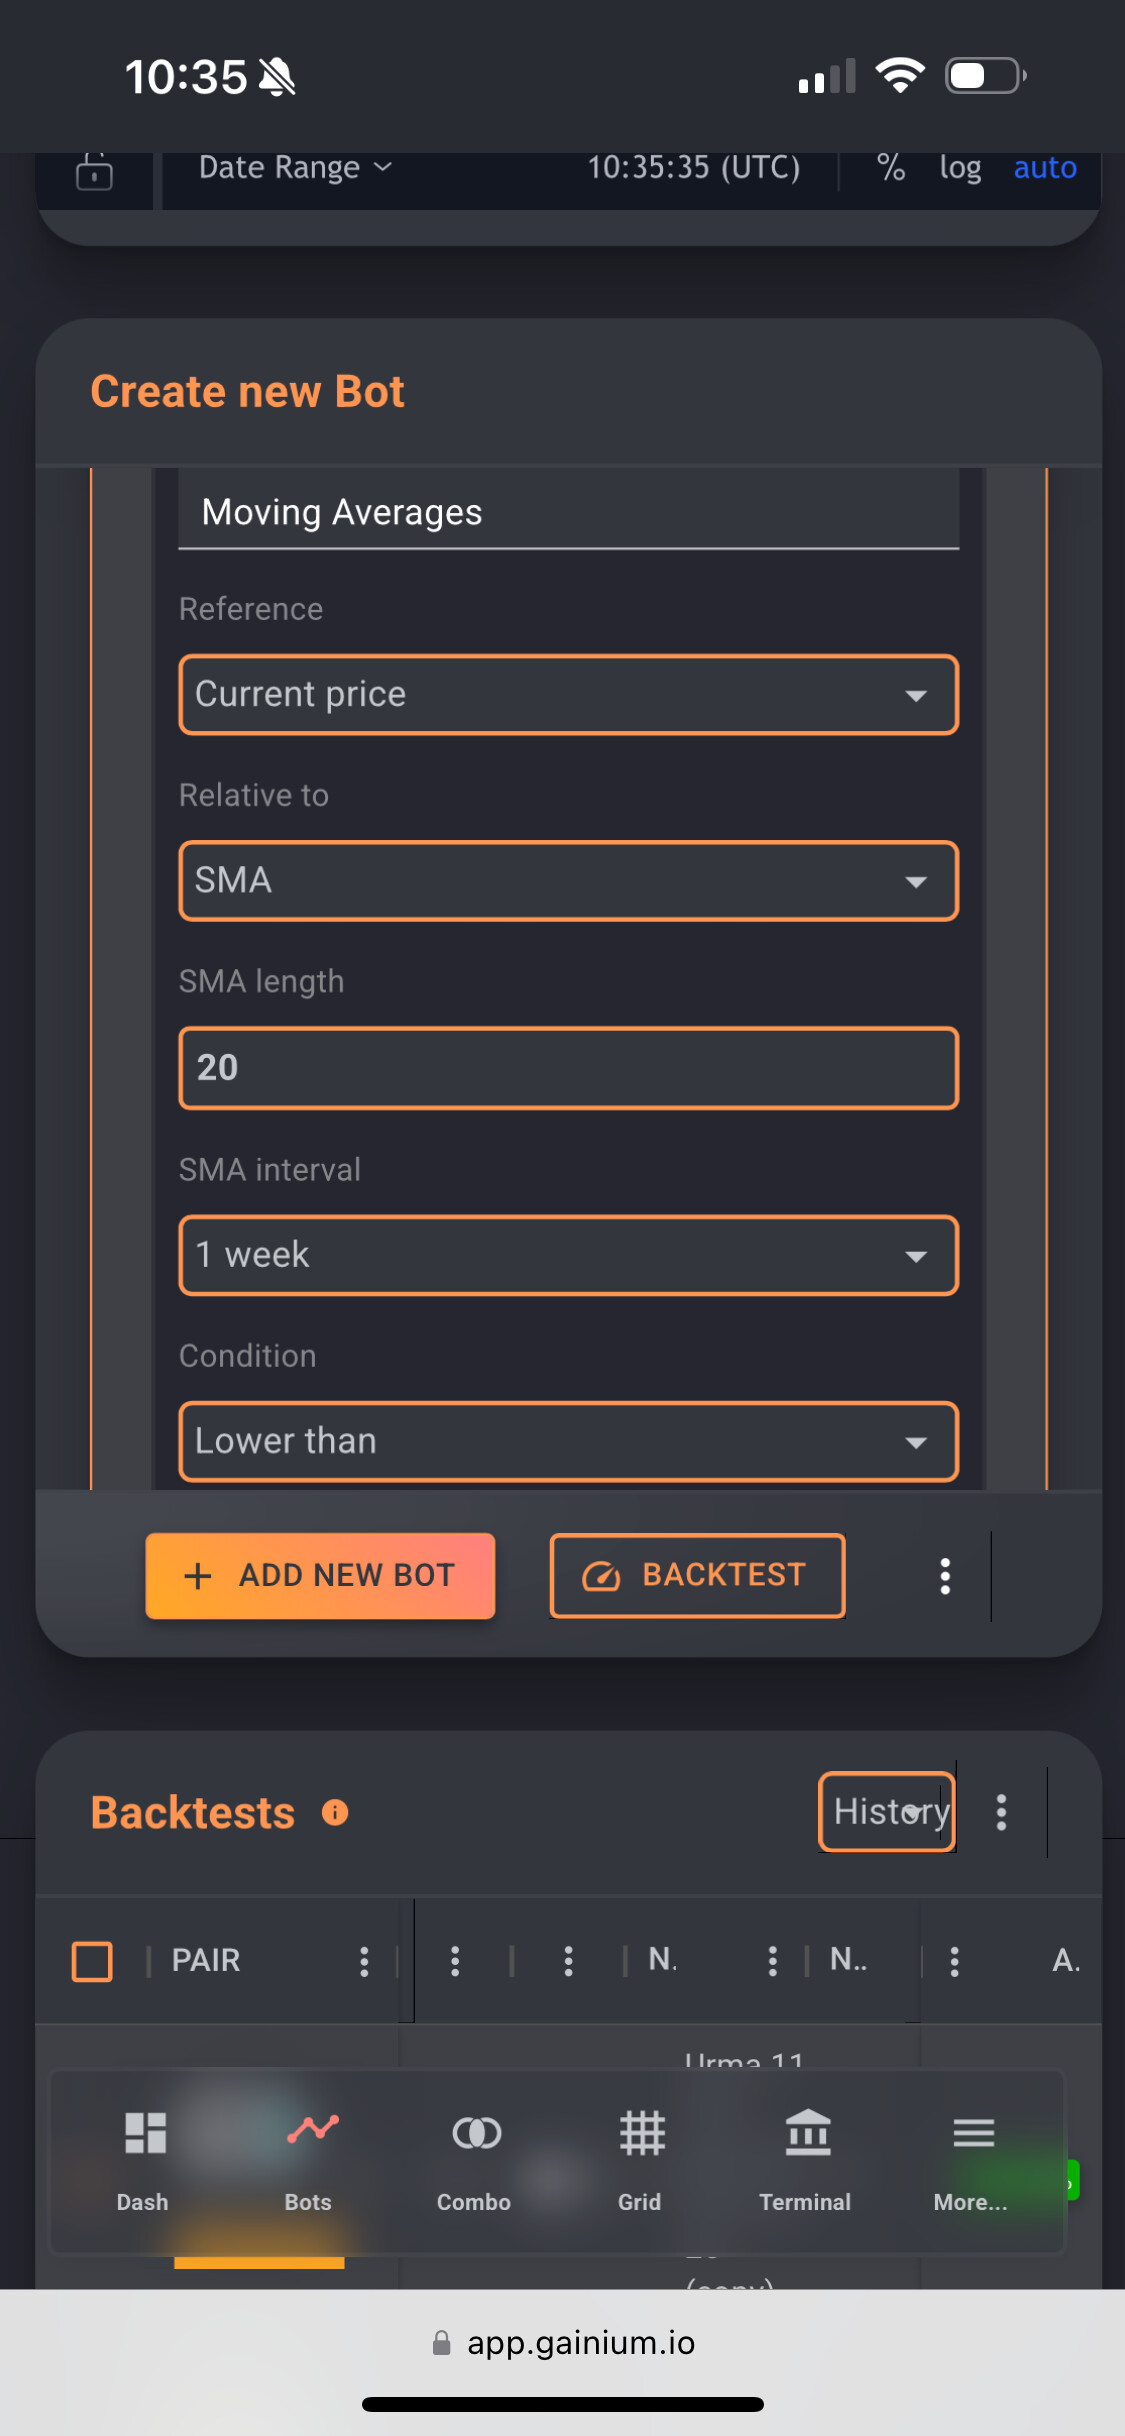
I think a simple was is to say:
If current price is less than 60% above the SMA and EMA, then open deal. But I can’t work out how to put 60% in the condition.
Also I need to make sure it’s 60% down from current price, not up 60% from the EMA/SMA.
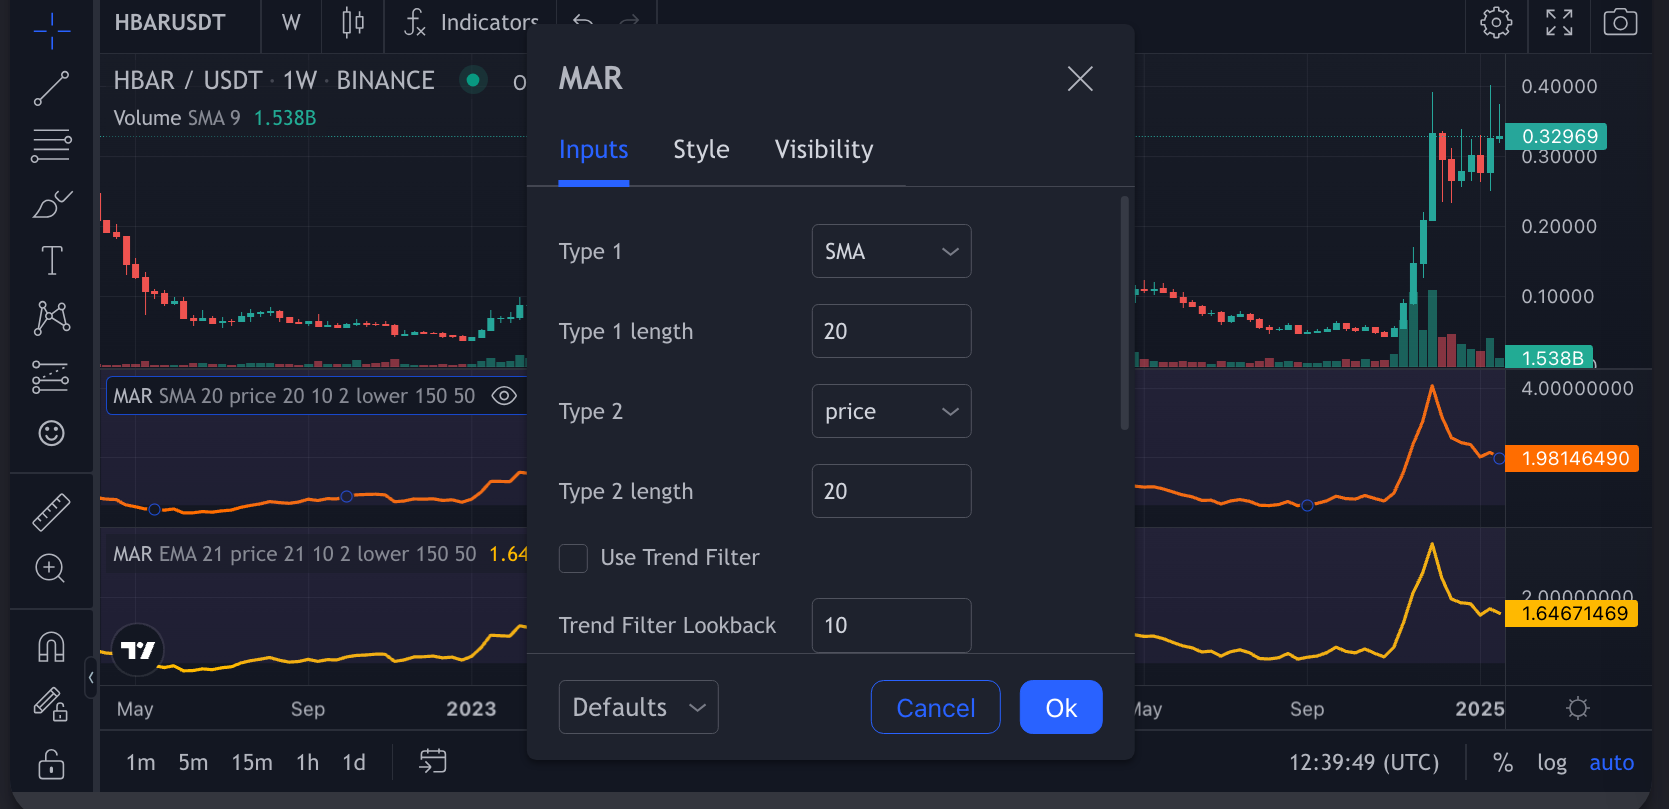
For that you need the MAR, rule should be higher than 0.6 between the moving average and current price. You can add two MAR and combine them with AND/OR.
@aressanch would you have a look at this setting and see if it matches what I’m after?
i.e. only open new deal if the BMSB is more than 60% below the current price
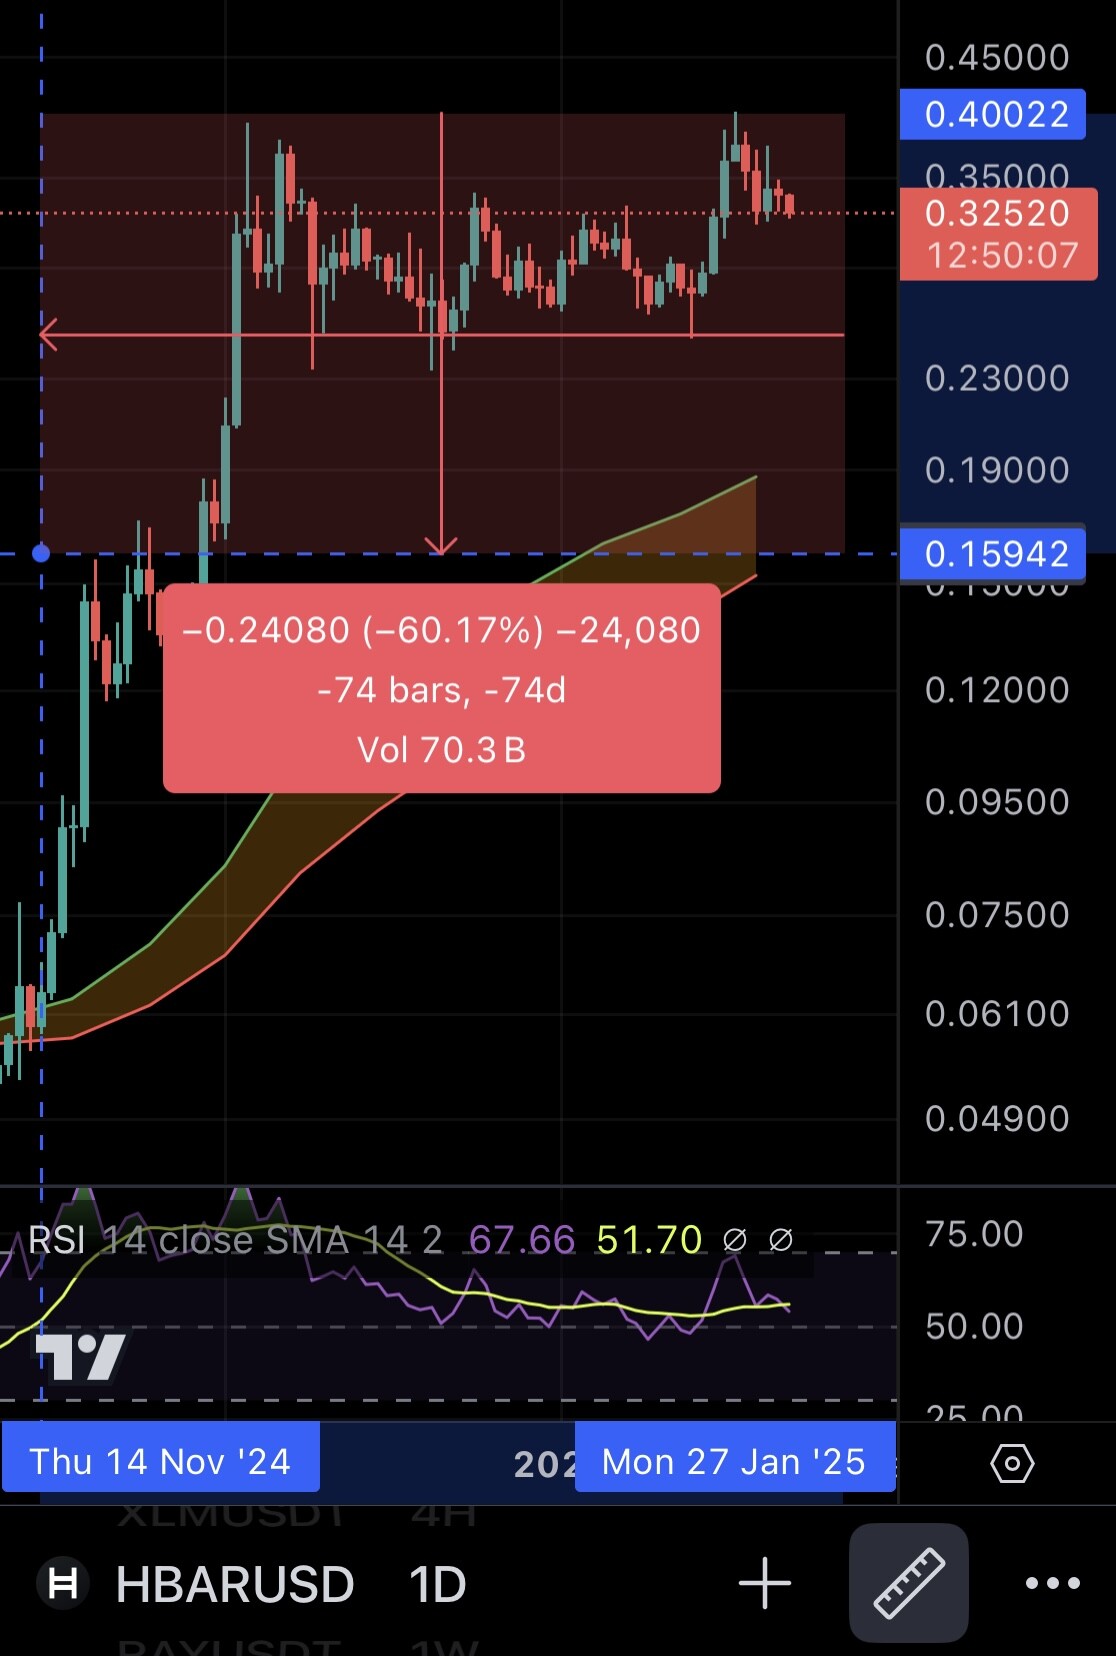
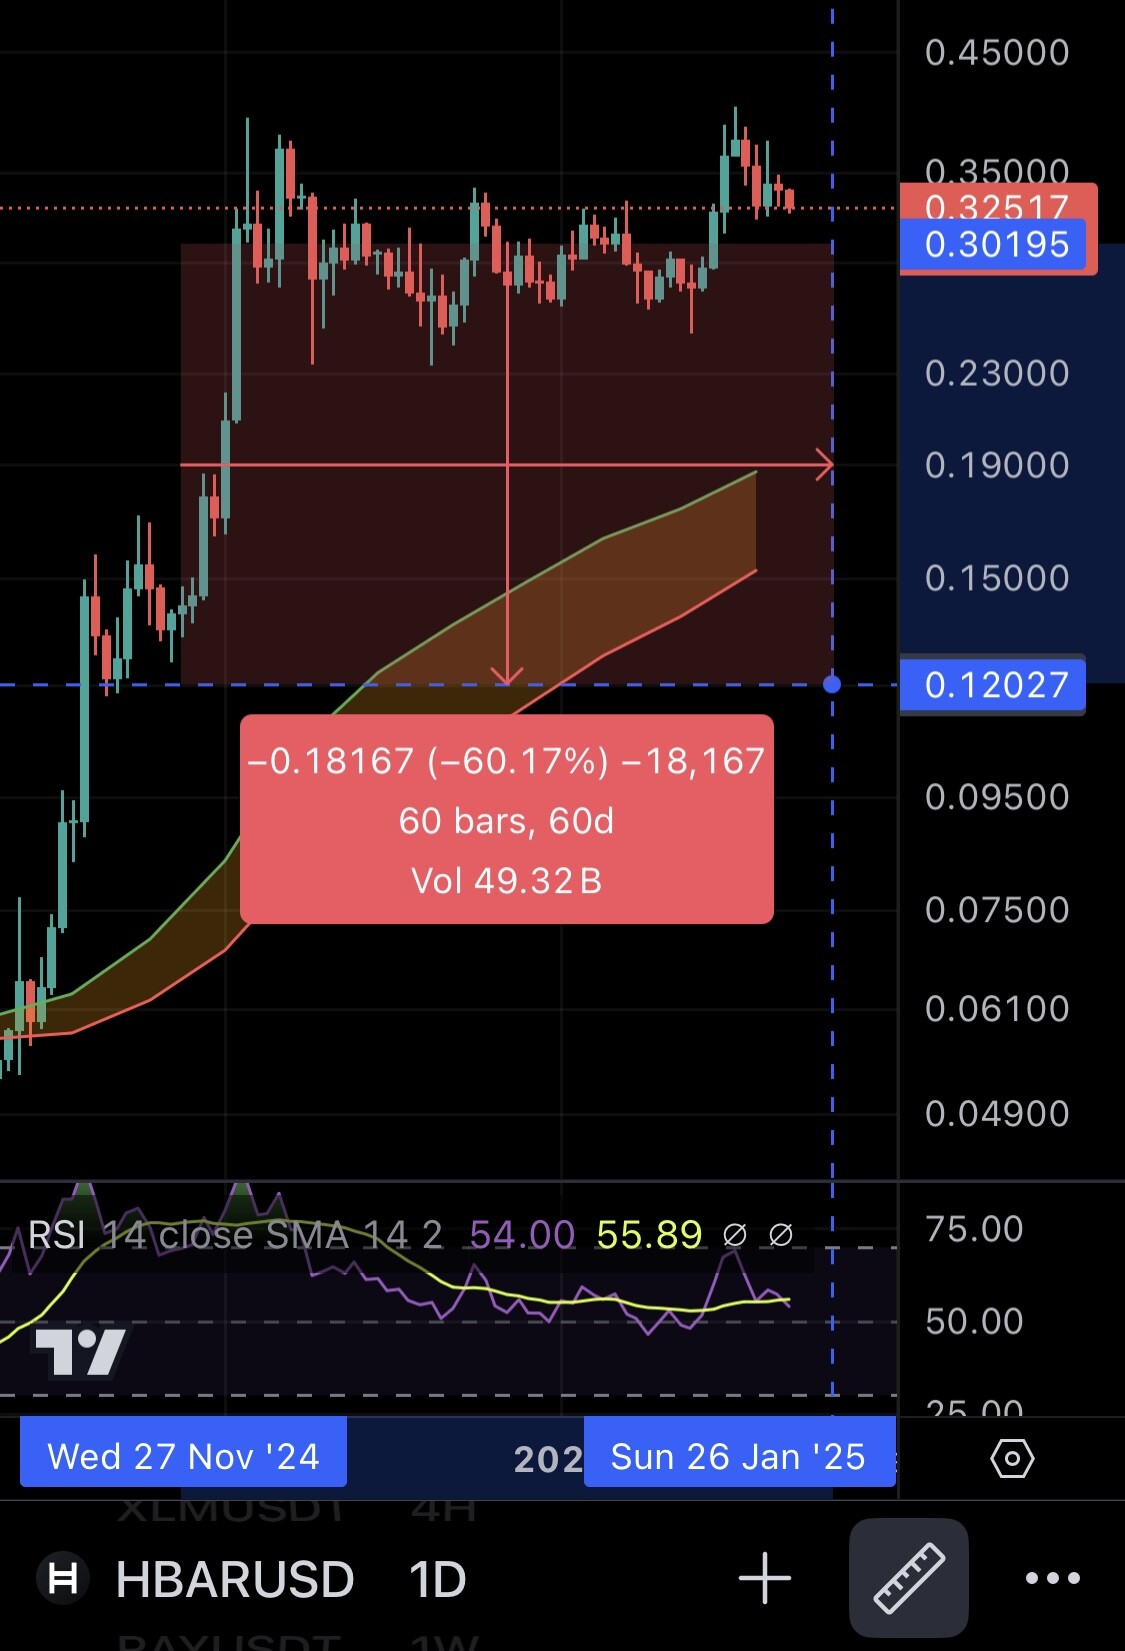
In that case something is wrong. If I draw a measure box down from price to the BMSB it is mostly less than 60% drop. And obviously sometimes negative cos price is below. I’m trying to stop it opening deals when price drop to BMSD is 60% or more. As in the price has gone too high.
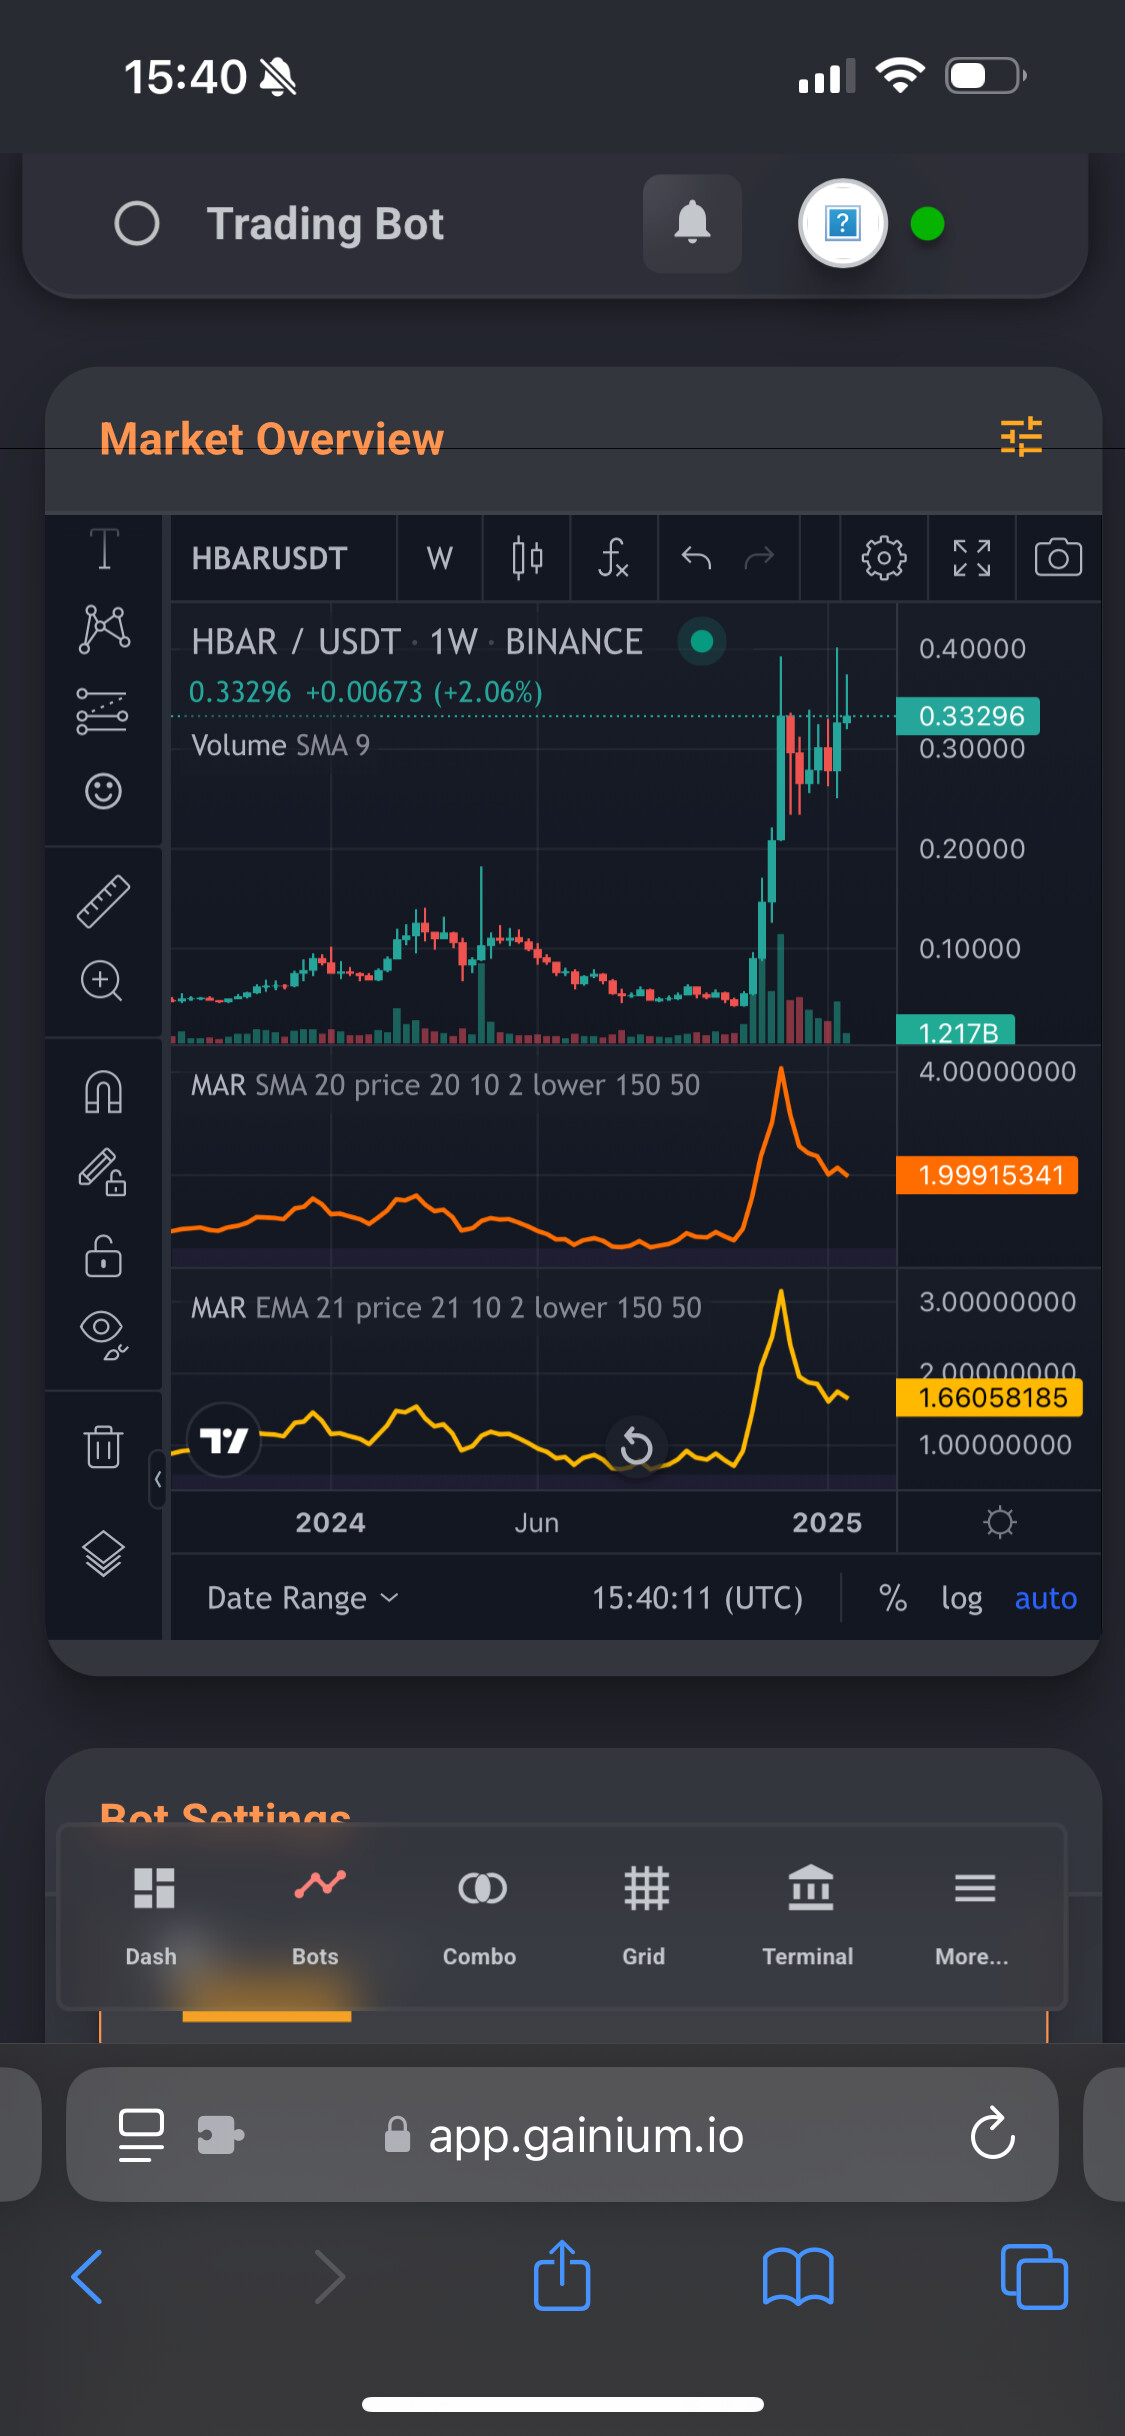
Just to demonstrate HBAR would have been within 60% for most of the last few weeks. Obviously I can’t show a moving measurement but you can visually see what would be within 60% and what wouldn’t.
Tried backtesting 73 days for both greater and lower than BMSB, and lower yields 0 deals, and greater yields 11 deals, regardless of what values I put in the condition value (e.g. 0.1 instead of 0.6)
You can’t compare them visually because they’re not the same kind of indicator. One is a moving average on price, the other is a ratio between moving average and price.
What makes you think that indicator would have provided different trades? Have you backtester it on tradingview?
Sounds about right. I also got no deals under 60% in the last couple of years. And over 0.6 is true most of the time, same for over 0.1.
I;ve noticed that the value being 0.6 probably isn’t 60%. If I put in 0, then I can see the entire MAR has a slight opaqueness. 1 moves the opaqueness up a bit on the chart so the bottom is black. 2 is more black, 3 more etc. 5 shows the entire area in my screenshots above in black. If I resize the MAR chart, then I can see the opaque area.
So I really don’t see that 0.6 is 60%. I think this is a case of Vasquez reading it wrong?