Hello everyone. This strategy is based on one presented on a very good YT channel called The Art of Trading. The strategy consists of two Bollinger Bands with different standard deviation to enter and exit a trade. The original strategy is not intended for the Cryptocurrency market, but I think it can be used. To do this, I changed the 1D TF parameters and adapted it to 1H, adding a 200 1D SMA as security.
The strategy can be very good if one applies it to a portfolio, but the disadvantage is that it can have a significant DD, which would not really be something given the return it can generate.
But needs stomic…
Unfortunately, I cannot find the original video, but I leave one from the channel that is quite interesting.
I hope someone finde it usefull and can improve it
BB Bot:
https://app.gainium.io/bot/6702a6e75b982ff591936669?a=1895&aid=share-bot&share=2355a9fb-4cd3-491a-a0f2-0d257a0e0c2e
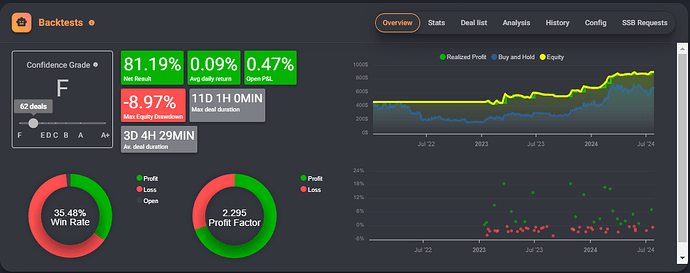
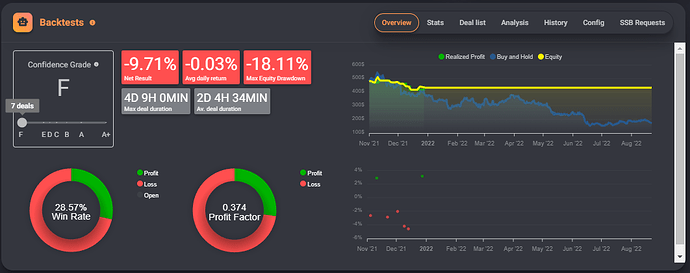
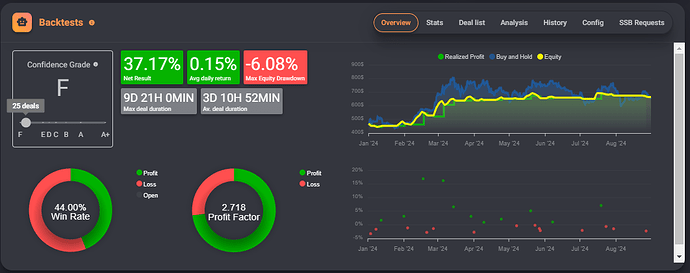
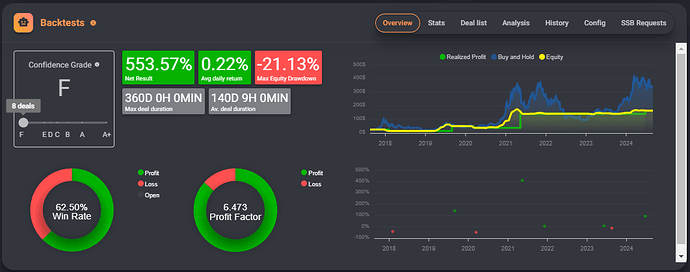
Backtests:
2022-2024
the Fall
2024
The original Strat in 1D TF
The Art of Trading (source)
4 Likes
I also have a strategy from YouTube but i need DMI indicator to test it
2 Likes
Thank you so much for sharing!
1 Like
hey @salmanhamza maybe can be adapted with an ADX and Sar.
DMI indicates the trend and the strength (ADX is part of DMI if not remember bad)
The Strength is ADX the trend direction could be Moving averages, supertrend, Sar etc.
I hope this help you
Hi everyone!
Thanks for sharing this strategy! As a new member here, I find it fascinating how Bollinger Bands can be adapted to the cryptocurrency market, especially on the 1H timeframe.
I’m curious about a few things and would love to hear your thoughts:
- Adapting to 1H: You mentioned adapting the original 1D settings to the 1H timeframe. Could you clarify what specific changes were made to the parameters to suit the lower time frame? I’d like to experiment with it myself.
- Reducing Drawdowns: Since you highlighted the significant drawdowns (DD) as a potential drawback, have you tried incorporating other indicators (e.g., RSI, MACD) to add another layer of confirmation? I wonder if this could help manage entries better and reduce DD without compromising the returns.
- 200 1D SMA as Security: I understand you’ve added the 200 1D SMA as a security filter. Could this also be useful if applied to other time frames, or do you find it works best on the daily chart?
I’m excited to try this out and see how it performs with some crypto pairs I’m following. I’ve used Bollinger Bands before, but I hadn’t considered combining multiple deviations like this.
1 Like
you welcome @gabportfoliohub 
1 - As adapted from original I only change the 1H TF not the entry condition or exit condition
2- As you will see strategy only have a Take Profit not Stop Loss. In order to let the strategy works as proposed I dont added more indicators, you must run a backtest and see if the max DD is something you can handle it if not you can start add indicators to improve it. The significant DD is in 1D TF. the Video will help you to clarify some concepts of what you can expect about this topic.
3-200 1D SMA is a classic filter used for Traders in big time frames, if the price goes below usually signify the price can be losing the trend. you will see strange price moves near this moving average.
Good luck there, and please share your findings and thoughts
1 Like
I dont know how to adapt it with adx, but it depended on DMI crossing down each other
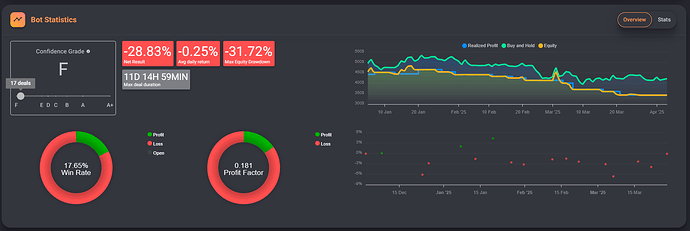
Well This bot is suffering the lack of an strong uptrend, and is at the limit of my realized DD limit.
What is good about the test is that it is facing the worst scenario with unforseen data. the only bad is it have no time to gather more resources to start with it.
