1/4 of the trading portfolio is used by the strategies
Hello!
I’ve been doing some backtesting to try new things on this strategy. I’ve chosen this S10 because it uses a trading bot and not a combo bot and it have allowed me to test a few things as using an indicator for deal start condition or try to compound the bot.
Context:
1. Backtesting periods: I have backtested all the conditions on 3 periods of 3 months in order to not have a too big deviation causing gaps in the backtest. The 3 periods are:
- february-march-april 2024
- november-december-january 2023/2024
- august-september.october 2023
2. Indicator choice: I decided to use a very simple indicator here, it was a market structure indicator, so each time a 1 min lower low was crossed it opens a new trade. Why I have chosen this indicator? Because I wanted to optimize a little bit the entry conditions without loosing to much time entering trades. The number of trades of each backtested period is the same with this setting.
3. Compounding: I just changed the currency reference from USDC to %free USDC to try to compound. For clarification I backtested an account with 2368$ with 5 and 20% USDC that more or less corresponds to 100 and 400 USDC.
Results:
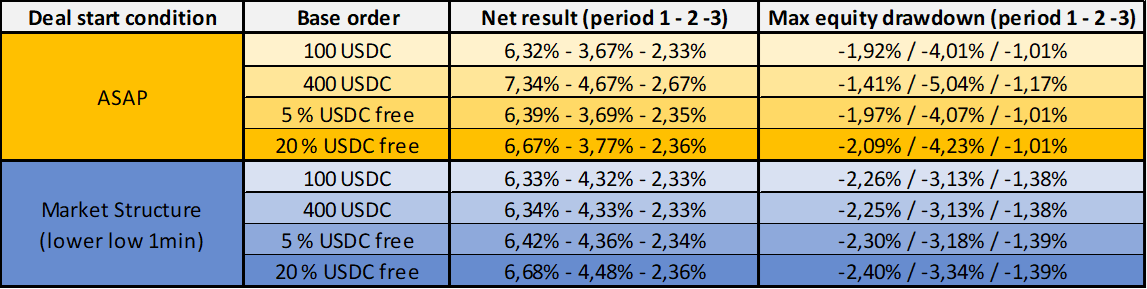
What I can say by looking at these results is:
-
That the market structure indicator seems to improve a little bit the net results, mostly on the second backtesting period. There is no conclusion to make on the drawdown as sometimes it gets better and sometimes worse.
-
The compounding condition seems to improve the net results obtained most of the time except for the time where I backtested with 400 USDC but the drawdown gets worse which makes sense as the position increases over time because if a crash occurs, a larger drawdown may also happen.
-
The best condition (400 USDC / ASAP) doesn’t make sense to me for now. I don’t understand why I am getting the best results with this one as it don’t use indicator or compounding. For me it seems a too large position that could result in a big lose if a big crash occurs, but I should look more into the details on this one.
Feel free to give your opinion or suggestions on this. See you! ![]()
ASAP is highly dependent on the period used. If the period is somewhat bullish, ASAP is likely to overperform the indicators, and when the period is bearish it will underperform. Having ASAP deals means being always in the market, so if the period is bullish it will translate to more deals and more profit. And always being in the market is a risk in itself, as you point out a sharp downturn will surely catch you.
Indicators may have lower performance, but as you are timing your entry and exit, your time in the market is less, and therefore your risk is lower. The goal is not necessarily to obtain the highest performance strategy, but to obtain the strategy that gets more performance as related to their risk. This is where the sortino ratio comes in handy.
2 Likes
Wooow it’s great that you spent some time looking into it and shared some insights about it
I start saying that the S-10 is still under development so it has something interesting (probably one of the most interesting strategies an ever looked into) but also things that needs improvements.
As @aressanch said ASAP really depends on the time you started the backtest which it could be an advantage or disadvantage mainly because the strategy it selves doesn’t rely on any timeframe but price ranges - this means it could move, close, start or get stuck (atm) not being linked to time.
The strategy tempts to draw lines across the chart spacing them evenly to catch any price movement - if the price goes up or down or sideways it won’t matter- why? Because we create traps in ranges ($70k to $60k and all the way down spaced evenly or $70k to $80k all the way up spaced evenly) simulating an infinite grid.
Introducing a moving SL (positive value) solved some issues improving speed and profitability since if closes the deal and restarts - but I’m not working on a way to making it more dynamic so if the price moves with high volatility it doesn’t close deals in negative but instead profits from it and also I’m looking to a way to make the drawdown more dynamic to cover a wider range.
The reason why I developed this strategy on a trading bot is mainly because allows us to merge deals if the price crashes at any point therefore our average price once merged will be quite competitive since we bought at every x%, while profiting from some deals via multi TPs.
Note - I know many traders running strategies using the min order size making practically any strategy affordable and low risk.
I will add more info when I have a moment and also some features suggestions about some IF conditions to support not only this strategy but any strategies that doesn’t come out of the box ![]()
1 Like
Thanks @aressanch and @Rossano for these clarifications! I understand now that the idea of adding an indicator is not that good because we want to trade in both directions and opening trades as fast as possible, I had a bullish bias on this.
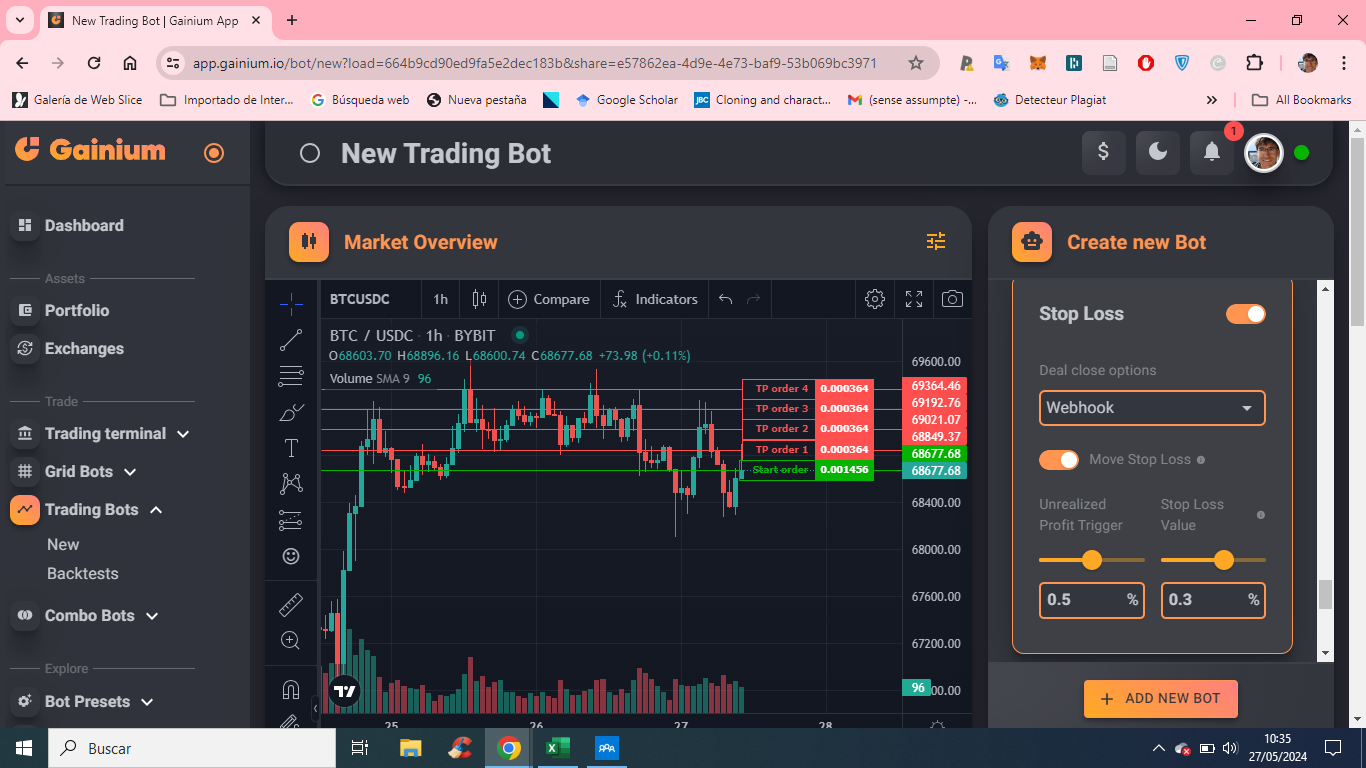
@Rossano I’ve noticed something strange on the S-10 0 MOVS strategy, there is by default a SL parameter with webhook. It is intended or it is a mistake? If it’s intended, how does this SL work in that specific case?
I’ve also experimented with high timeframe indicators like the Supertrend or Moving Average on a 1D chart. The bot will open deals as soon as there is a long-term bullish trend. The issue arises when the market turns bearish, but the Supertrend indicator still signals a bullish trend. To address this, I added another short-term Supertrend, such as on a 15-minute chart. In some strategies, this yields decent results, but executing trades immediately (without indicators) often outperforms using indicators. However, as @aressanch mentioned, it’s all about managing drawdown and achieving a higher Sortino Ratio.
Yes this trick is used so we don’t have any actual SL (or you can use -100% SL).
Webhook is even safer as it will never trigger but it will allow the moving SL to move in positive as soon as one TP is filled - hope it’s clear
You will also see multiple deals atm that’s because it testing the dynamic drawdown manually so at the moment deals overlaps
Indicator gives you and indication of something but you can only decide a trend - there are way of using indicators so the signals is neutral but then I found it’s always better (for this strategy) to use ASAP as neither timeframes or indicators make any impact since we are playing with the movement of the price only
2 Likes
Hi @Rossano
You are talking about “merging” deals with the S10 strategy? What do you mean with that? Is it something we have to do manually?
Thanks
Yes it basically merges two or more deals to average the price of our ‘overall price range’ - what does it means? simple you look at the all chart as one range with a general overall price range.
If we covered already x% deviation with all simultaneous deals and the price keeps moving opposite to our deals we can merge then into one to give the new merged deal a better change to close by TP.
Yes at the moment we can merge the deals manually while in the meantime I suggested an AUTO-Merge feature within a specific price range deviation (% of deviation from the current price)
So far the bot in less than a month made a good 3.5% ROI
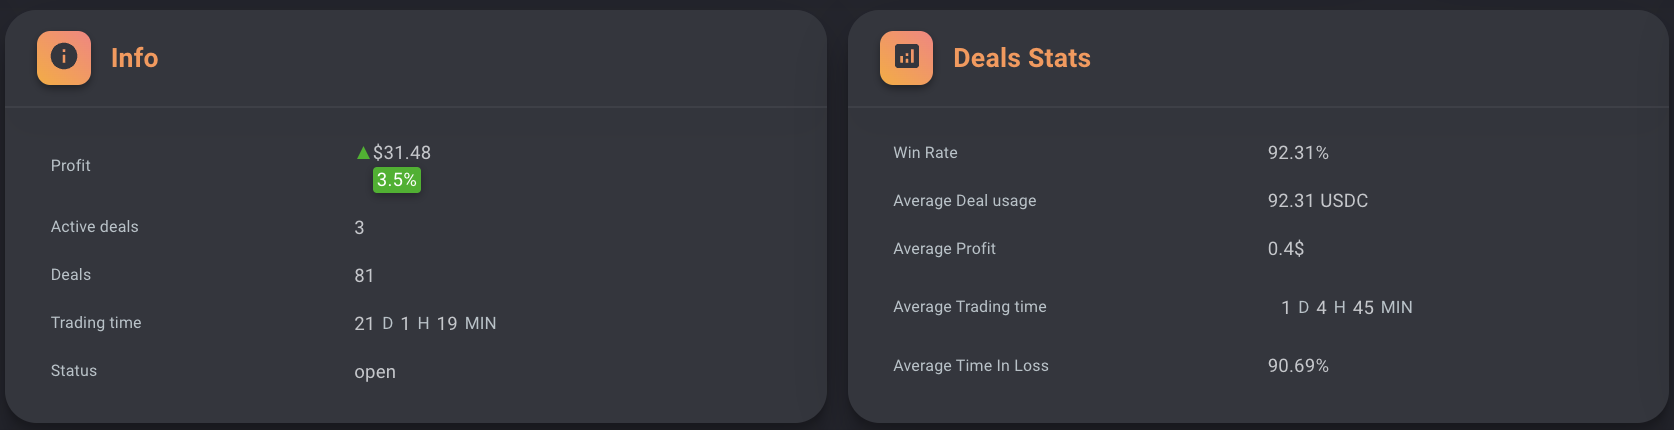
You can check the live stats on a real account here - NO SECRETS!
Okay I think I’ve just now understood this strategy haha.
How does it work to manually merge Deals? where is this function?
Thank you for explaining this.
1 Like
You are very welcome - simple, go in the open deal panel select the deals you are willing to merge and press MERGE at the top
Just diving into this strategy. Have you made any improvements on this bot since this was posted? Or is the link you provided still a bot you are running right now?
Also, is there an advantage of using USDC over USDT?
No fees on Bybit for USDC ![]()
1 Like
Thanks Perez!
Have you been using this bot now for a few months, or on Paper? Hows your results looking?
Hello @Brandon
Yes I have been using the strategy for monthson real account and being profitable, I am super happy with it ![]() I can try to show you some results, the only problem is that from time to time I have been adjusting some parameters, changing bot allocations, creating new bots S10 for low volatility conditions and I don’t really have 1 bot with a considerable amount of data.
I can try to show you some results, the only problem is that from time to time I have been adjusting some parameters, changing bot allocations, creating new bots S10 for low volatility conditions and I don’t really have 1 bot with a considerable amount of data.
For example, I have this one open on BTCUSDC (long and Short profiting in BTC and base as @Rossano suggested ![]() ) S10 - Long (profit BTC)
) S10 - Long (profit BTC)
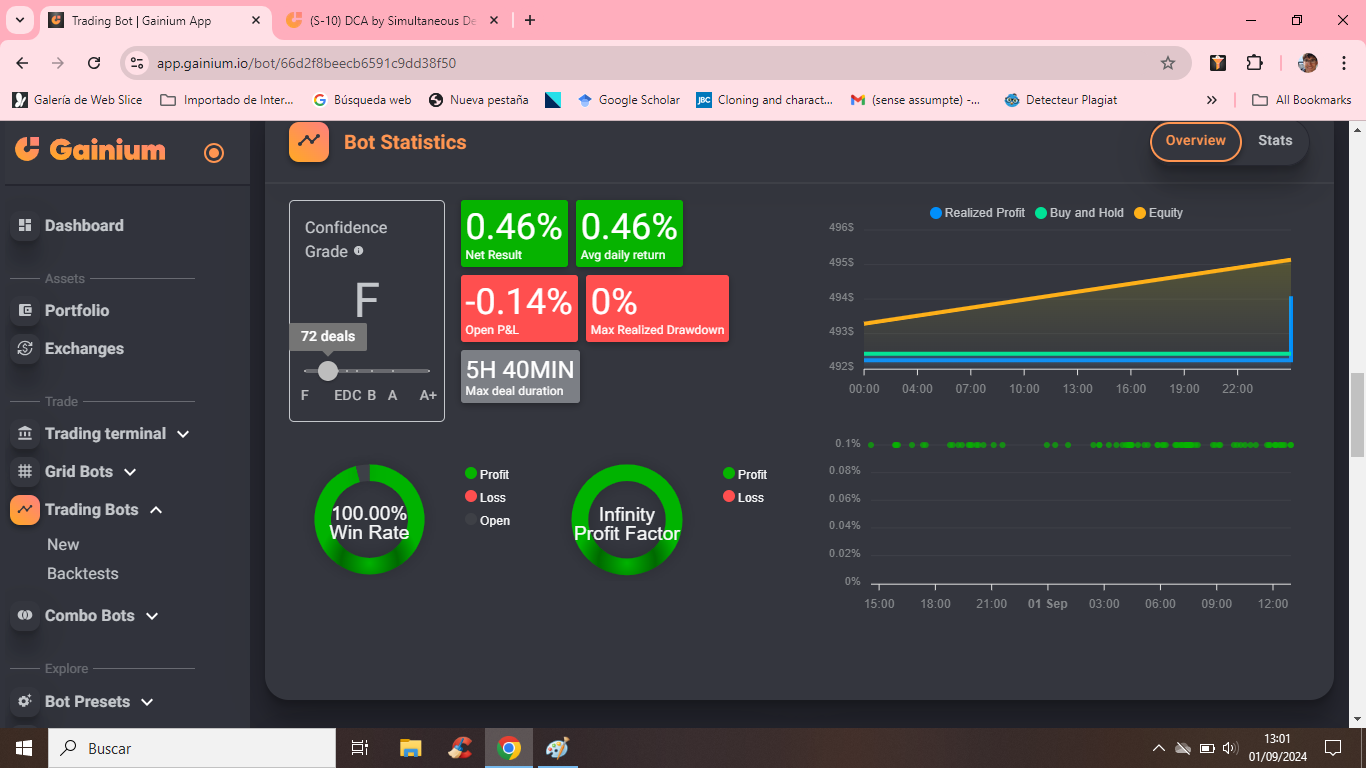
And the results for the eleven last days are as follows :
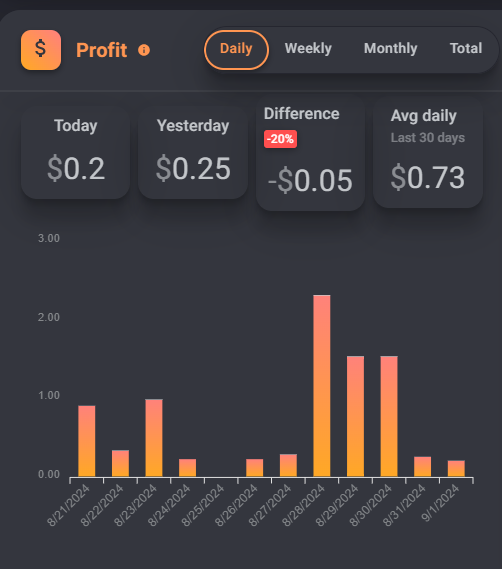
Is not much but it’s ok for me. You may remark that it’s not the same version than @Rossano 's one because I only have 1 TP, the reason is that I prefer to not get stuck with partially filled deals, with this one I keep things simple and when the TP is hit the deal is closed but his version has also other advantages.
I’m running also some low volatility bots but they are more risky to be stuck in the market. In general what I do with these bots is that I only allocate a certain number of deals to be opened (20 for example), and as long as the price don’t move too much they are very profitable very fast but when price move too far, I just change the entry conditions from ASAP to MANUAL and I just wait for the price to come back to close all my deals (it can last for several days or weeks sometimes so you should really use it with caution).
Low volatility Short S10 (profit BTC)
I was trying to write a topic on the Trading Strategies section about managing risk with the S10 strategy but with the full-time work it’s taking me some time, it will be there soon ![]()
3 Likes