Smart Money Concepts (SMC) - Indicators and automation

Hello everyone.

I have been thinking about SMC for some time and ways to implement it in bot trading, either as a full strategy or as a confluence/filter for other strategies. If you don’t know what I am talking about, here is some intro.


What is Smart Money?

Smart Money refers to capital invested by individuals or entities with a thorough understanding of the markets and access to comprehensive information. These include institutional investors, central banks, hedge funds, and market insiders. They often move in large volumes and can significantly influence market trends.

Why Understand Smart Money?

Recognizing Smart Money movements helps traders predict potential market movements. By aligning with Smart Money, you can potentially increase your chances of successful trades as you move in parallel with experienced market participants.


So the central concept here is that large players make money by moving the market against the retail trader’s expectations and sucking the liquidity where they expect retail traders to place their stop losses. Therefore, by anticipating their move and trading in alignment with them, you will be on the right side of that market movement.

This concept has been going around for a while, and now all retail traders talk about SMC. The issue then is that it becomes a cat-and-mouse chase, where one is trying to anticipate the move of the other.

Here is an example of someone already advising to trade against the traditional SMC concepts:

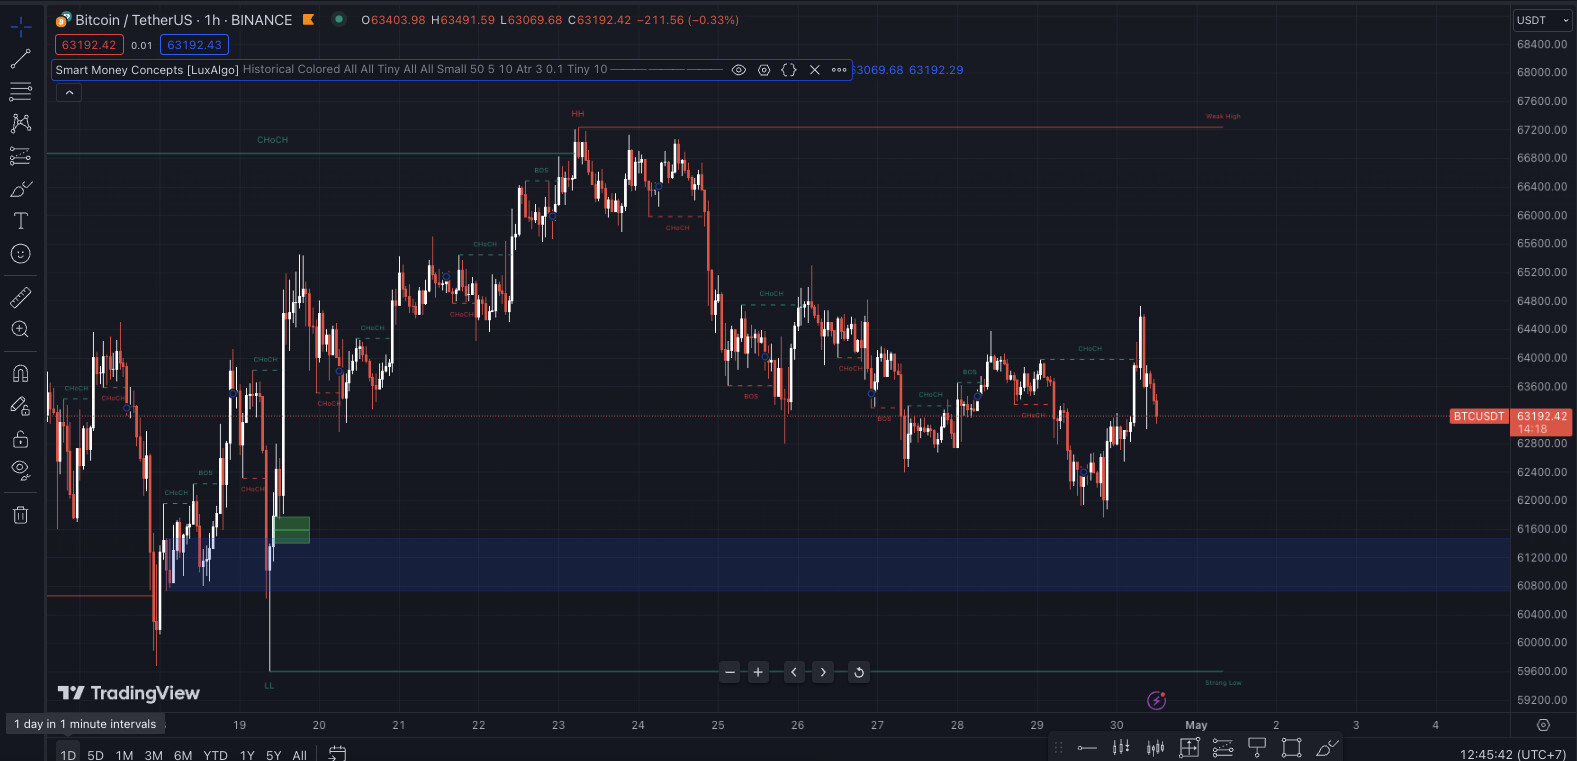
As soon as I have ported those concepts to Gainium, we will be able to test whether it is more profitable to trade against or in favor of traditional SMC. First, I am considering this indicator by Lux Algo. Here is a good video intro about this indicator:

Because the indicator is quite extensive, I am going to split it into different indicators:

SMC Indicators

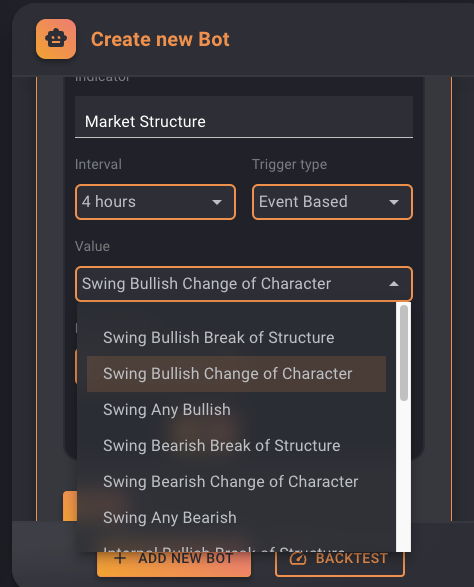
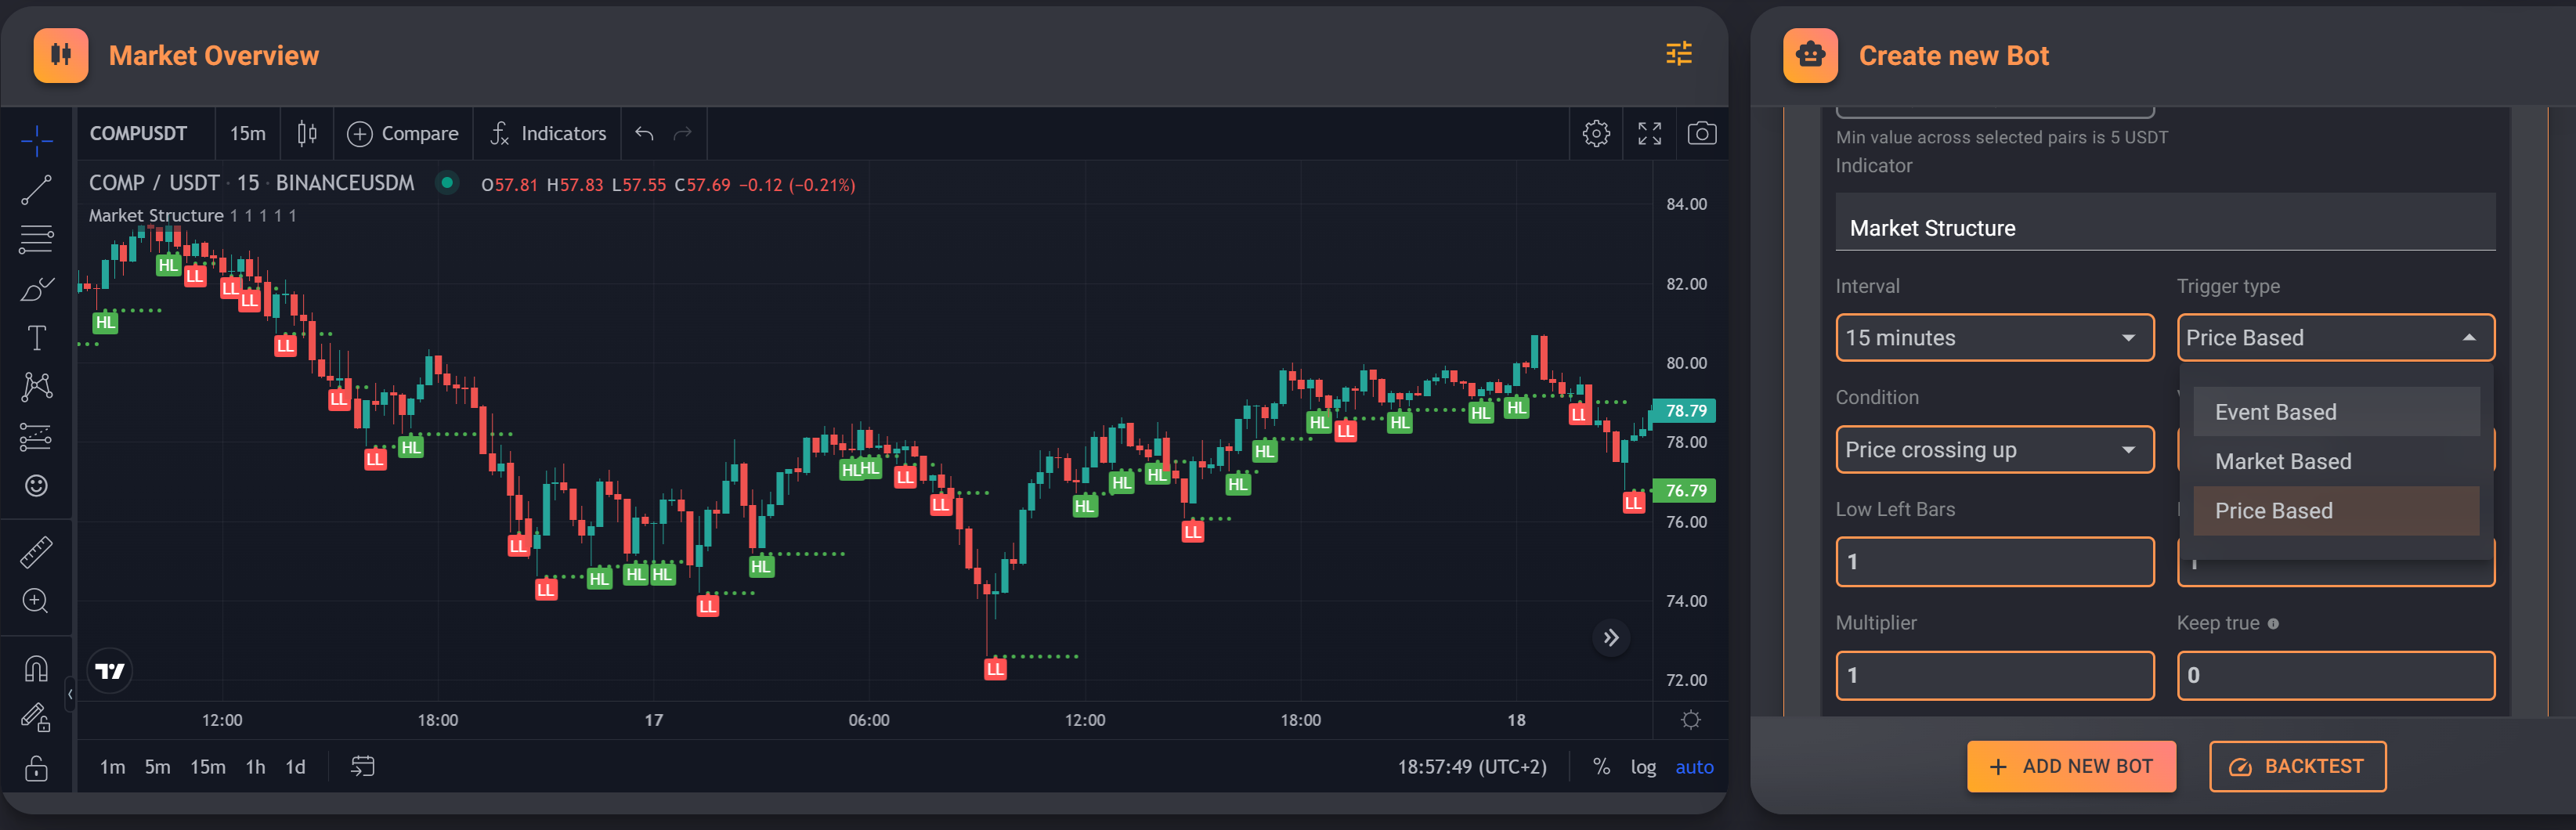
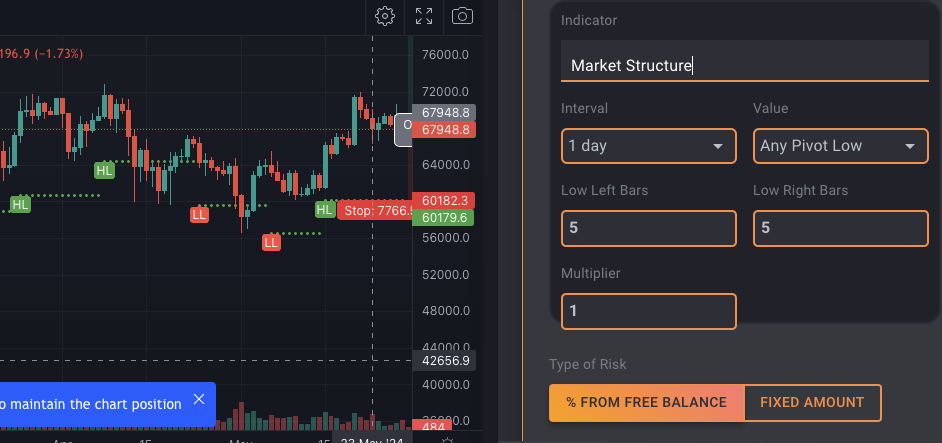
Market Structure Indicator

This will cover the fundamental market formations that SMC traders must identify: higher highs (HL), higher lows (HL), lower highs (LH), and lower lows (LL).

A bullish market structure occurs on HHs and HLs, and it will continue until there is a Change of Character (ChoCh), at which point it changes to a bearish market structure on LHs and LLs. When ChoCH occurs, the market breaks a significant swing point in the opposite direction of the current trend, which changes the market structure.

This will allow us to filter trades by market structure, independent of whether you want to use the rest of the SMC. At the moment, one of my favorite indicators for detecting trends is the SuperTrend indicator, so it would be good to see how filtering by market structure changes the profitability of strategies.

Order blocks and Fair-value gaps

In the context of Smart Money Concepts (SMC) trading, “order blocks” and “fair value gaps” are two key terms used to understand market dynamics and potential price movements. Here’s a breakdown of each:

Order Blocks

An order block is a price level or zone identified as having a significant trading activity, usually by large institutional players or “smart money.” These are typically seen as areas where:

  • Bullish Order Block: A noticeable amount of buying occurred before the price increased significantly. This is often considered a demand zone or support area where traders might anticipate future price increases if the price returns to this level.
  • Bearish Order Block: Significant selling took place before the price dropped noticeably. This is viewed as a supply zone or resistance area where prices could be pushed down again if revisited.

Order blocks are often identified using historical price charts where a swift move from a consolidation or accumulation zone occurred. Traders use these blocks to gauge potential entry or exit points, predicting that price reactions could occur when these levels are retested.

Fair Value Gaps

Fair value gaps (sometimes called “gaps”) are areas on a price chart where the price has moved sharply up or down, with little to no trading in between, essentially leaving a ‘gap’ in the normal price pattern. These gaps represent areas where the fair value hasn’t been established due to the rapid price changes.

In SMC trading, fair value gaps are essential for several reasons:

  • They often act as targets for price to return to, as traders believe the market will move back to explore these price levels to establish fair value.
  • Closing a gap can indicate that the market has stabilized or found equilibrium at that price range after the initial volatility that caused the gap.

Traders use both order blocks and fair value gaps to forecast potential market movements. By identifying these zones, traders aim to align their strategies with the probable actions of institutional or smart money, thus potentially increasing their chances of successful trades. These concepts are particularly useful in setting up automated trading strategies, where such technical cues can trigger entries and exits without manual intervention.

Here are examples of order blocks (blue) and fair value gaps (green) as shown by the Lux Algo indicator:

Questions for you

Have you used these concepts in your trading? What is your experience? What rules do you use to enter/exit trades? Have you automated them?

1 Like

I haven’t used SMC yet. Rather, I am trying to find a way to manage my funds independently of the market to neither get stuck for a long time nor miss profits with what I invested. Of course, that way the buy orders usually stay small in comparison to the required funds for safety order and you may miss gains with that but you also hopefully prevent losses. It’s on us to decide how to balance between non-investing or buy + safety orders or all-in. All approaches have their pros and cons.

Hi Ares!
I’ve been trying to use SMC concepts for some time, I really tthink that some concepts as FVG, orderblocks or liquidity make sense if they are used correctly with market structure (you can add Break Of Structure concepts also to start a new trend). What I find complicated with these concepts is that we often make the mistake of trying to catch contrarian movements, for example, you’ve spotted a very interesting orderblock or FVG, and as soon as the price arrives, bim! It overtakes your SL (which has become liquidity) and then moves in the opposite direction, which can be called a failed-break. The best way to use SMCs is to have trend confirmations, not to try to catch the orderblock you spotted at the start, but rather to observe what happens. For example, if the price arrives at the orderblock identified at the 4h timeframe, liquidity can be caught by a large candle following the trend and then a candle with a lot of volume in the opposite direction. At this point, we can say to ourselves, OK, the person with the biggest hands of the market has filled all his orders, now he’s going to try to sell in the other direction. In this case, you need to look for confirmation on smaller timeframes. Often, if a new trend emerges, 15-minute FVGs are at least partially filled, which means you can place an SL without too much risk. FVGs can be caught in combination with a momentum indicator to refine the entry, for example.
In short, the whole problem is to catch the trend targeted by the biggest hands; when you’re in it, everything goes well, otherwise you’re always on the opposite, which means you easily get SL.
In short, what makes these concepts so attractive is the fact that you can set up a position with a potentially very tight SL and multiple TPs enabling you to achieve very high RRs. But the difficulty here remains in placing the order and the SL in the right places.
I’m curious to see how you tackle this problem, especially by trying to find an automated solution. I’d be happy to help if necessary!

3 Likes

That’s great! Maksym is working on the market structure indicator now. I will ping you after they are ready, it would be great if we can figure out a strategy out of them,

2 Likes

Super excited about the implementation of SMC!
I already use liquidity sweeps, OBs, Breakers and FVGs for starting my bots using alerts from tradingview. I manually select the price to start the deal and the rest is for the DCA bot to finalize.
The method is not perfect but a dynamic dca spacing helps a lot.
I’m waiting for this new feature like a kid waiting to open his Christmas presents. :grin:

1 Like

That’s awesome!

The first step is of course to finish the indicators so we can see all these concepts on the chart.

The second step is creating the entry and exit rules, and here is where we should use our brain power. As you can see in the videos above, there are some rules we could follow for the traditional SMC, but since institutions are likely targeting retail traders using SMC, we also need to test the anti-SMC rules (if we can call it that :sweat_smile:).

I think the market structure will be testable today.

3 Likes

The market structure indicator is ready. I haven’t had time to test it yet, but feel free to give it a go and let me know how it goes.

3 Likes


Good job with the market structure indicator!
I would’ve wanted to have the option to customize “low left bars” for “event” and “market based” triggers , just like I can for the “price based” trigger.
Don’t know if it possible or not .

The positions of those indicators look very promising to use them for trading. But the configured interval has to be equal or greater than that of the chart otherwise to see the indicator’s results in the chart. Maybe there could be a warning if that isn’t the case?

Hi guys, I have only just stumbled across gainium while searching for some kind of bot for this exact kind of SMC.
So I’m quite keen to learn what this product can do In the way of automation etc.

When you say contrarian movements, getting stopped out & “failed break” on a reversal causing you to be liquidity, It sounds like that’s because you are the liquidity bro If I’m understanding you correctly.
You need to wait & clearly Identify Inducement first which is confirmed as a liquidity purge when price suddenly reverse’s & breaks CHoCH with some momentum & conviction??
This is now when you have confirmed a directional bias & begin looking for ur Institutional reference points, FVG, OB etc.
If you wait for Inducement followed by a purge of liquidity there is no “failed break” after that as that was the failure break?
Price is now looking to balance the previous liquidity imbalance with the next retrace following failure to either retrace to a FVG or an OB.
I personally only kinda target OB If I’m being set up on the 1hr or 4hr & gauging the momentum on the 15M looking for entry.
As you mentioned, this strategy requires extremely accurate entries with a ridiculously tight SL if you want to leverage it to its full potential while also lowering ur overall risk!
I’m constantly trying to nail these pullbacks to FVG or OB in different situations as close to perfect as possible with stupid tight SL using TradingViews “Replay Mode” for the last 6 months while slowly finding patterns through repetition & Its actually very surprising just how often price with respect these levels almost every time!
Well MM, Smart Money etc use these as price extremes as their trading ranges…
Fib level 1.272 will almost always be the moves Institutional Target every time!
Fib level 0.71 will almost always be their Entry & I use the 0.79 as my level to place SL slightly below.
There is nothing new about these levels, but how you measure them in every different situation within previous structure is where the cluster fuck begins, but it is well worth the torture.
The difference between the 0.71 & 0.79 is usually a great threshold to run the tightest SL possible.

Is there going to be a future option here for automatic calculation of Max leverage on each trade & Margin required based on every trades entry price & SL price while considering a percentage of risk on the trading accounts total available capital??

Without the above option & compounding exponentially with the highest possible leverage would make this strategy much less profitable & a lot riskier.

Would love to get a bot set up for the 1M chart strategy, it would be a lot easier due to No directional bias required & same entries & SL placement.

1 Like

This is already possible, it was recently introduced as part of the tools we will need to make this strategy work. Risk:Reward now available in the Terminal and Trading Bots

Sounds like you have a lot of experience with this setup so your knowledge will be very valuable. We haven’t started on the Order blocks & Fair Value Gaps indicator yet, had a few higher priority tasks. But we will start on those soon. I will update this thread and hopefully we could come up with a viable strategy.

1 Like

Welcome here! :wave: ok this is a long message I will answer by parts.

Yes of course, the theory is always easy but when you are there trying to trade, the signals are not always 100% clear because the timeframe reference of the “big hands” can be hard to find. As market is fractal, there is a probability that when you have identifed the inducement + liquidity + reverse + CHoCH + momentum/convinction this is only the manipulation of the institutionals to find more liquidity on a higher timeframe and reverse to the other side. Also is never the same to backtest on Tradinview and to live trade with your own money, taking risks and sometimes having strings of tight SL that get destroyed, becuase even if you have the good direction, it can be quite tricky to enter a position with a tight SL.

Depending on the timeframe, you can always find failbreaks, price is not always respeting FVG and orderblocks but most of the time yes, I agree.

Ordeblocks and FVG are really a thing that I want to test here but could be quite tricky to implement. The only way that I found to test this is by using webhooks but it’s not properly backtestable. I’m really waiting for this implementation :smiley:

Also using Fibonacci is the same, it can be useful but it never works 100%. I think that Fibonacci could be used to select different TP targets that could make sense and this could be used with the risk:reward parameters that have been implemented recently.

When you are saying 1M, you are saying 1minute or 1month? Because as I see this, markets have always a direction and are fractal so it doesn’t matter if it’s 1 minute or 1 month, there is always a direction. On the 1 minute the directional bias is on the higher timeframes (15 minutes/1hour), and for the 1 month is even higher but I don’t think that it can be backtestable with the data available here.

It took me some time to answer but I would be glad to continue the discussion, of course I made my opinion about my experience but I might be wrong at some points. Could be super interesting to share the backtest ideas on SMC concepts as it is how I learned trading and I would love to see if an automatic strategy can be long term profitable

See you around and let’s make something profitable and automatic :smiley:

1 Like

SMC is far from an easy to understand strategy…