This strategy takes parts of other previously illustrated strategies and combines them to solve some of the common problems.
The strategy is an accumulation strategy that uses simultaneous deals within price percentages (dynamic price %).
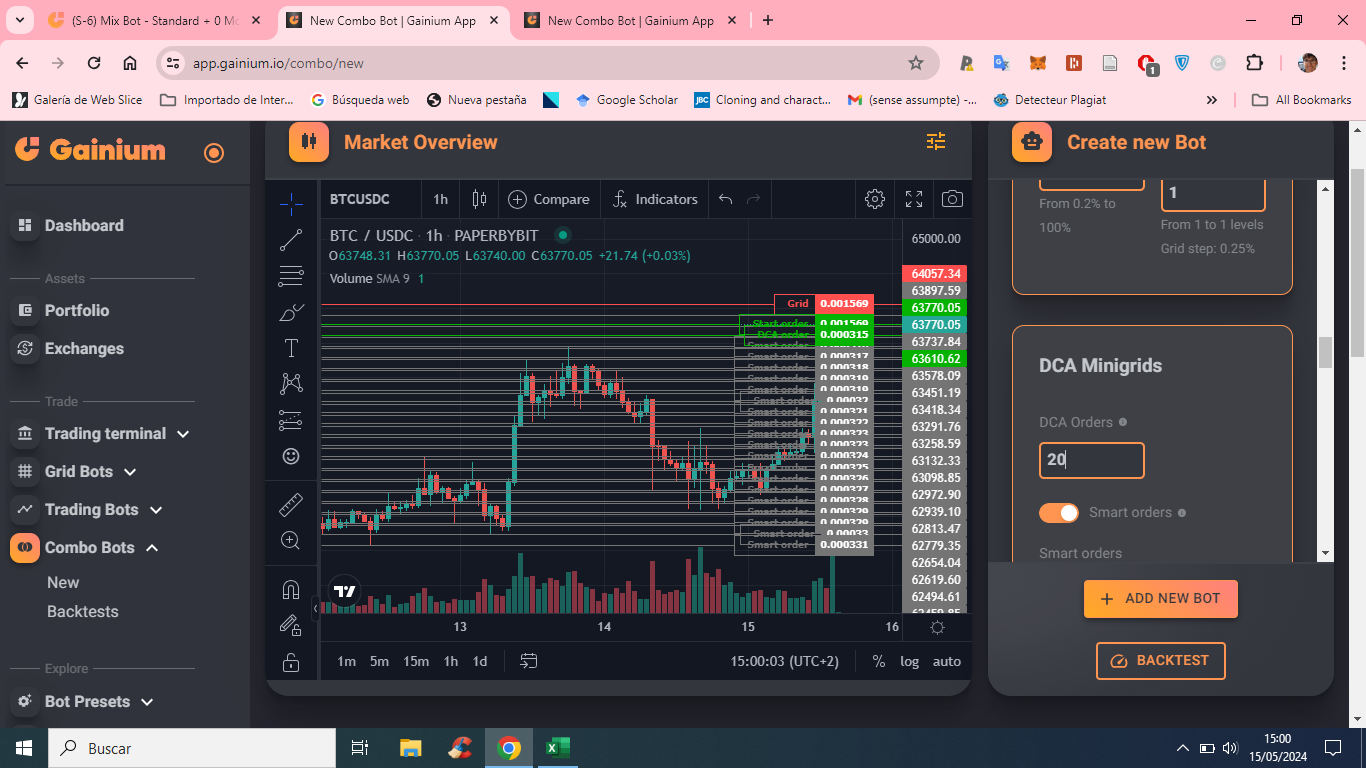
To reduce the deal position while averaging the price, each DCA has only one minigrid (no active minigrids) this way we sell the previous bought DCA order with each price bounce.
The strategy uses the MAX DCA TP for the first time - thanks to the fixed TP it is possible to close deals faster once the breakeven is exceeded.
Mix the logic until you find the one that works best for you
This is an interesting concept - selling each bought DCA independently.
Maybe worth mentioning that 0.25% grid spacing is best for pairs with no fees. Have you backtested other spacing or tried pairs with the usual 0.1% fee?
You are right - the MIX + 0 MOVS strategy is for 0 fees only.
I’m also running the same strategy ( STANDARD) but with 1% spacing and the results are very similar the only difference is that I added base minigrid to see how to perform during different market conditions.
I will post some backtest results as soon as I have a moment
Hi @Rossano, I started looking at your strategies and I have some questions :
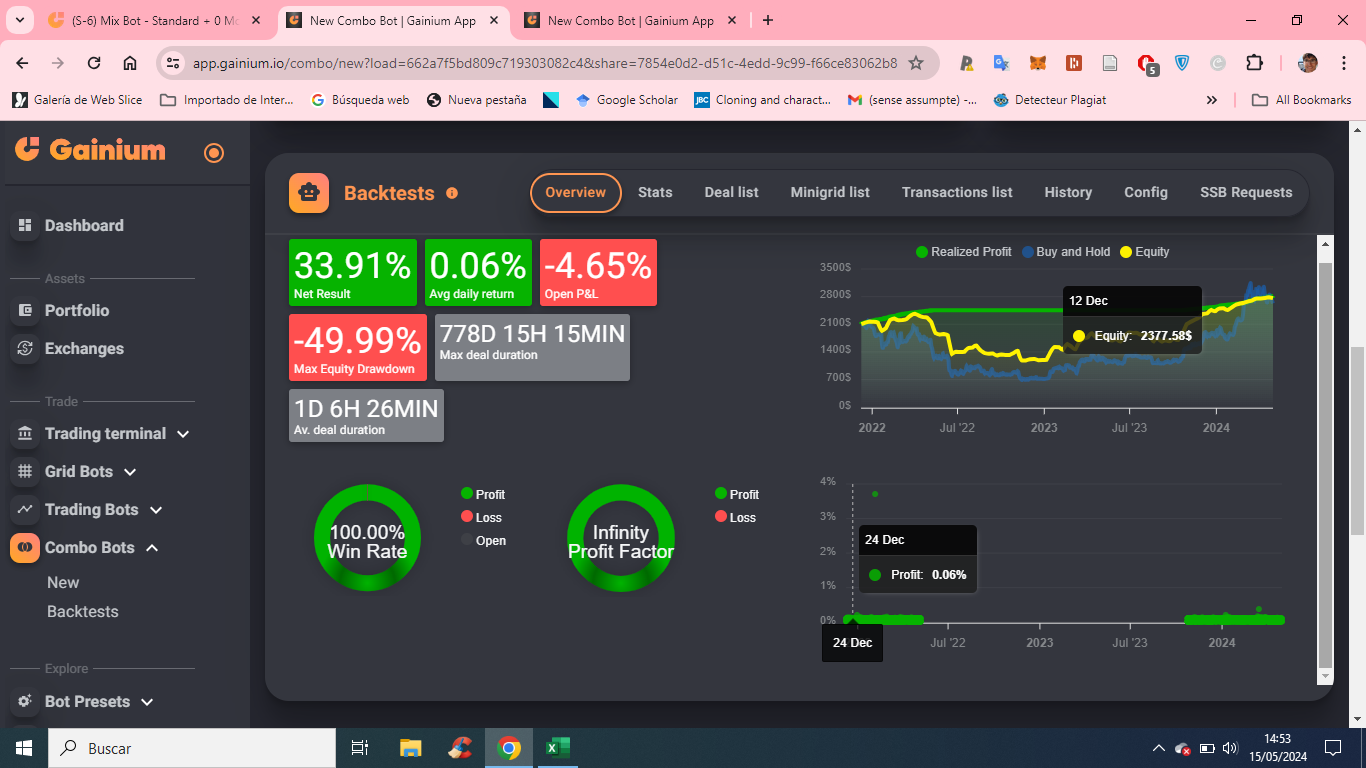
1. How do you backtest the full range of BTC price? I mean when I do the backtests by myself, I obtain this following results for a 3 year backtesting starting from 30-04-24 :
If you pay attention to when the deals have been made, it’s only during a short period of time and the reason of this is because you only have a certain amount of visible deals (the 20 DCA orders calculated at the actual price)
3. Do you have any leads or clues about how to do compounding using these combo bots? I know that the work is in progress but when I will better understand how these strategies operate, I want to put myself at work to try to solve this, but if you have some starting ideas it would save me some time or allow me to contrast with what I will be doing
Thanks for these super interesting strategies! There is a lot of good work here, I’m super curious about the future of this
So seems like you are using the S-6 0 movs which is a bit advanced because it needs manual intervention every now and then (not always) the gap you see in the backtest is because as you said the price covered all simultaneous deals and then the bot waited for a long time before closing the deal.
The are two things I do as part of the 0 movs strategy
I manage the risk and fund manually, means that if there is a pump I keep opening simultaneous deals and if there is a drop over the set deviation I then look at what happened and make a decision
decide what to do - add funds and start a new deal (new range), wait, invert the deal - we are in spot so I’m not worried about any market condition
The strategy can fail only in one case - world economy crashes and BTC won’t be used by any one anymore
I will post backtest results when I have a moment - quick tip, run backtests in shorter periods even every 3 or 6 months to see how the strategy works - you will see that it’s unlikely that you see a major drop in one go and if happens the push back is stronger
Investigate S-6 to start with then you will see why I also run a 0 movs version - the compounding version will need a different logic as one bot is always growing in $ value while the second it doesn’t - this means that the first needs to feed two bots at once - also you need to use a single subaccount and not two.
I have some questions regarding the managment of your funds for this strategy. Let’s say that you want to invest 1000$. If I understood well, you cannot invest the full amount at the beginning because the price might cover all the simultaneous deals at some point. So my first question is :
How many funds (in % of the total) do you reserve in order to add funds again?
How do decide to invert the deal?
By inverting the deal, do you mean changing base to quote?
So in that strategy you are not using two simulateneous bots (one collecting base and the other quote)?
Can you give an example of funds management for this strategy knowing that you want to invest 1000$ and expecting the market to crash to 1000$ BTC price? The same question for a BTC going to 1 million $?
Sorry for all these questions, I’m sure that you probably answered them before in your Telegram channel but I couldn’t find it on the FAQ, take your time to answer, I’m not in a rush
I’ll breakdown the info so they can be easily digested
Assuming you are still referring to the S-6 0 MOVS - the main purpose of this strategy is to fill all the small gaps between the grid lines so while the STANDARD uses 1% for example (main bot) the 0 MOVS uses 0.25% spacing (filler).
The 0 MOVS is more aggressive and has to be managed closely because it uses the same amount of funds but it covers a smaller range (5% per deal). The main purpose is to don’t let the price go anywhere and profit from every small movs even when the market doesn’t move it generates small grid profits.
Think at your bot as a a gun - you have 5 bullets that cover about 25% deviation then you are not cover - 25% is already a big movement for me but I’m also ready to add another 25% if needed - so if the bot to cover the first 25% uses $1000 I will keep in mind that I may need another EXTRA $1000 to cover a CRASH drop. Would I block that EXTRA in the bot? nope I will use for something else but I need to make sure they will be available when you need them.
I ofter get the same question - and if we are at $70K and the price goes to $10K and I’m not covered? RELAX if you suddenly wake ups and you find that the price crashed to $10K - just add a new DCA and it will bring the avg price and TP down - RELAX we are in spot and we own the asset
It’s very rare that I invert the deal but it’s possible since we are buying in spot - bear in mind that if you sell $100 of BTC you will then need $101 to actually call it profit since reselling what you bought is just a refund (hope it make sense)
No I mean selling the collected BASE (BTC) using a short bot (SPOT) - it may be a bit more complex to do but I will leave it as the last option as the all point of the strategy is collecting BTC - it may apply to those coins we don’t want to collect anymore (as it happened to SOL a while ago).
Yes I updated the link - you will see that one is collecting BTC one is collecting USDC (stable)
I have never seen BTC crashing on one single candle of 1 second - If I invest $1K for example and I cover 25% deviation it means that I’m ready to cover 4 times the same deviation for a total of 100% or $4K.
The main point of these strategies series is to accumulate as much BTC as possible at EVERY price, this means that I’m happy to buy BTC at $1 or $100K this way it’s like if we bought our BTC always at $50K - bear in mind the when the price decrease we are able to buy more BASE with less money means that even our avg. price will improve at every low buy. If BTC goes to $1 Million I think the economy we all know is going to change forever - if that’s the case just watch and enjoy - the range will automatically move up to infinite.
Someone asked how many simultaneous deals the strategy would need to cover -100% drawdown?
It’s not really needed to cover -100% drawdown as we profit form the small fluctuations and push backs.
Let’s suppose BTC is a $100K and the price starts dropping without an end - this below is a table showing how the first 4 to 5 orders are more than fine
Certainly! Here is the updated table with the column title changed to “Deal Number” and “Deal” added to each number:
BTC Drawdown from $100K to $0
Deal
Drawdown (%)
Price (BTC $)
Deal 1
0
BTC $100,000
Deal 2
-25
BTC $75,000
Deal 3
-50
BTC $56,250
Deal 4
-75
BTC $42,187.50
Deal 5
-100
BTC $31,640.63
Extra deals
Deal 6
-125
BTC $23,730.47
Deal 7
-150
BTC $17,797.85
Deal 8
-175
BTC $13,348.39
Deal 9
-200
BTC $10,011.29
Deal 10
-225
BTC $7,508.47
Deal 11
-250
BTC $5,631.35
Deal 12
-275
BTC $4,223.51
Deal 13
-300
BTC $3,167.63
Deal 14
-325
BTC $2,375.72
Deal 15
-350
BTC $1,781.79
Deal 16
-375
BTC $1,336.34
Deal 17
-400
BTC $1,002.26
Deal 18
-425
BTC $751.69
Deal 19
-450
BTC $563.77
Deal 20
-475
BTC $422.83
Deal 21
-500
BTC $317.12
Deal 22
-525
BTC $237.84
Deal 23
-550
BTC $178.38
Deal 24
-575
BTC $133.79
Deal 25
-600
BTC $100.34
Deal 26
-625
BTC $75.25
Deal 27
-650
BTC $56.44
Deal 28
-675
BTC $42.33
Deal 29
-700
BTC $31.75
Deal 30
-725
BTC $23.81
Deal 31
-750
BTC $17.86
Deal 32
-775
BTC $13.40
Deal 33
-800
BTC $10.05
Deal 34
-825
BTC $7.54
Deal 35
-850
BTC $5.66
Deal 36
-875
BTC $4.25
Deal 37
-900
BTC $3.19
Deal 38
-925
BTC $2.39
Deal 39
-950
BTC $1.80
Deal 40
-975
BTC $1.35
Deal 41
-1000
BTC $1.01
These values maintain a consistent drawdown percentage of 25% for each level.
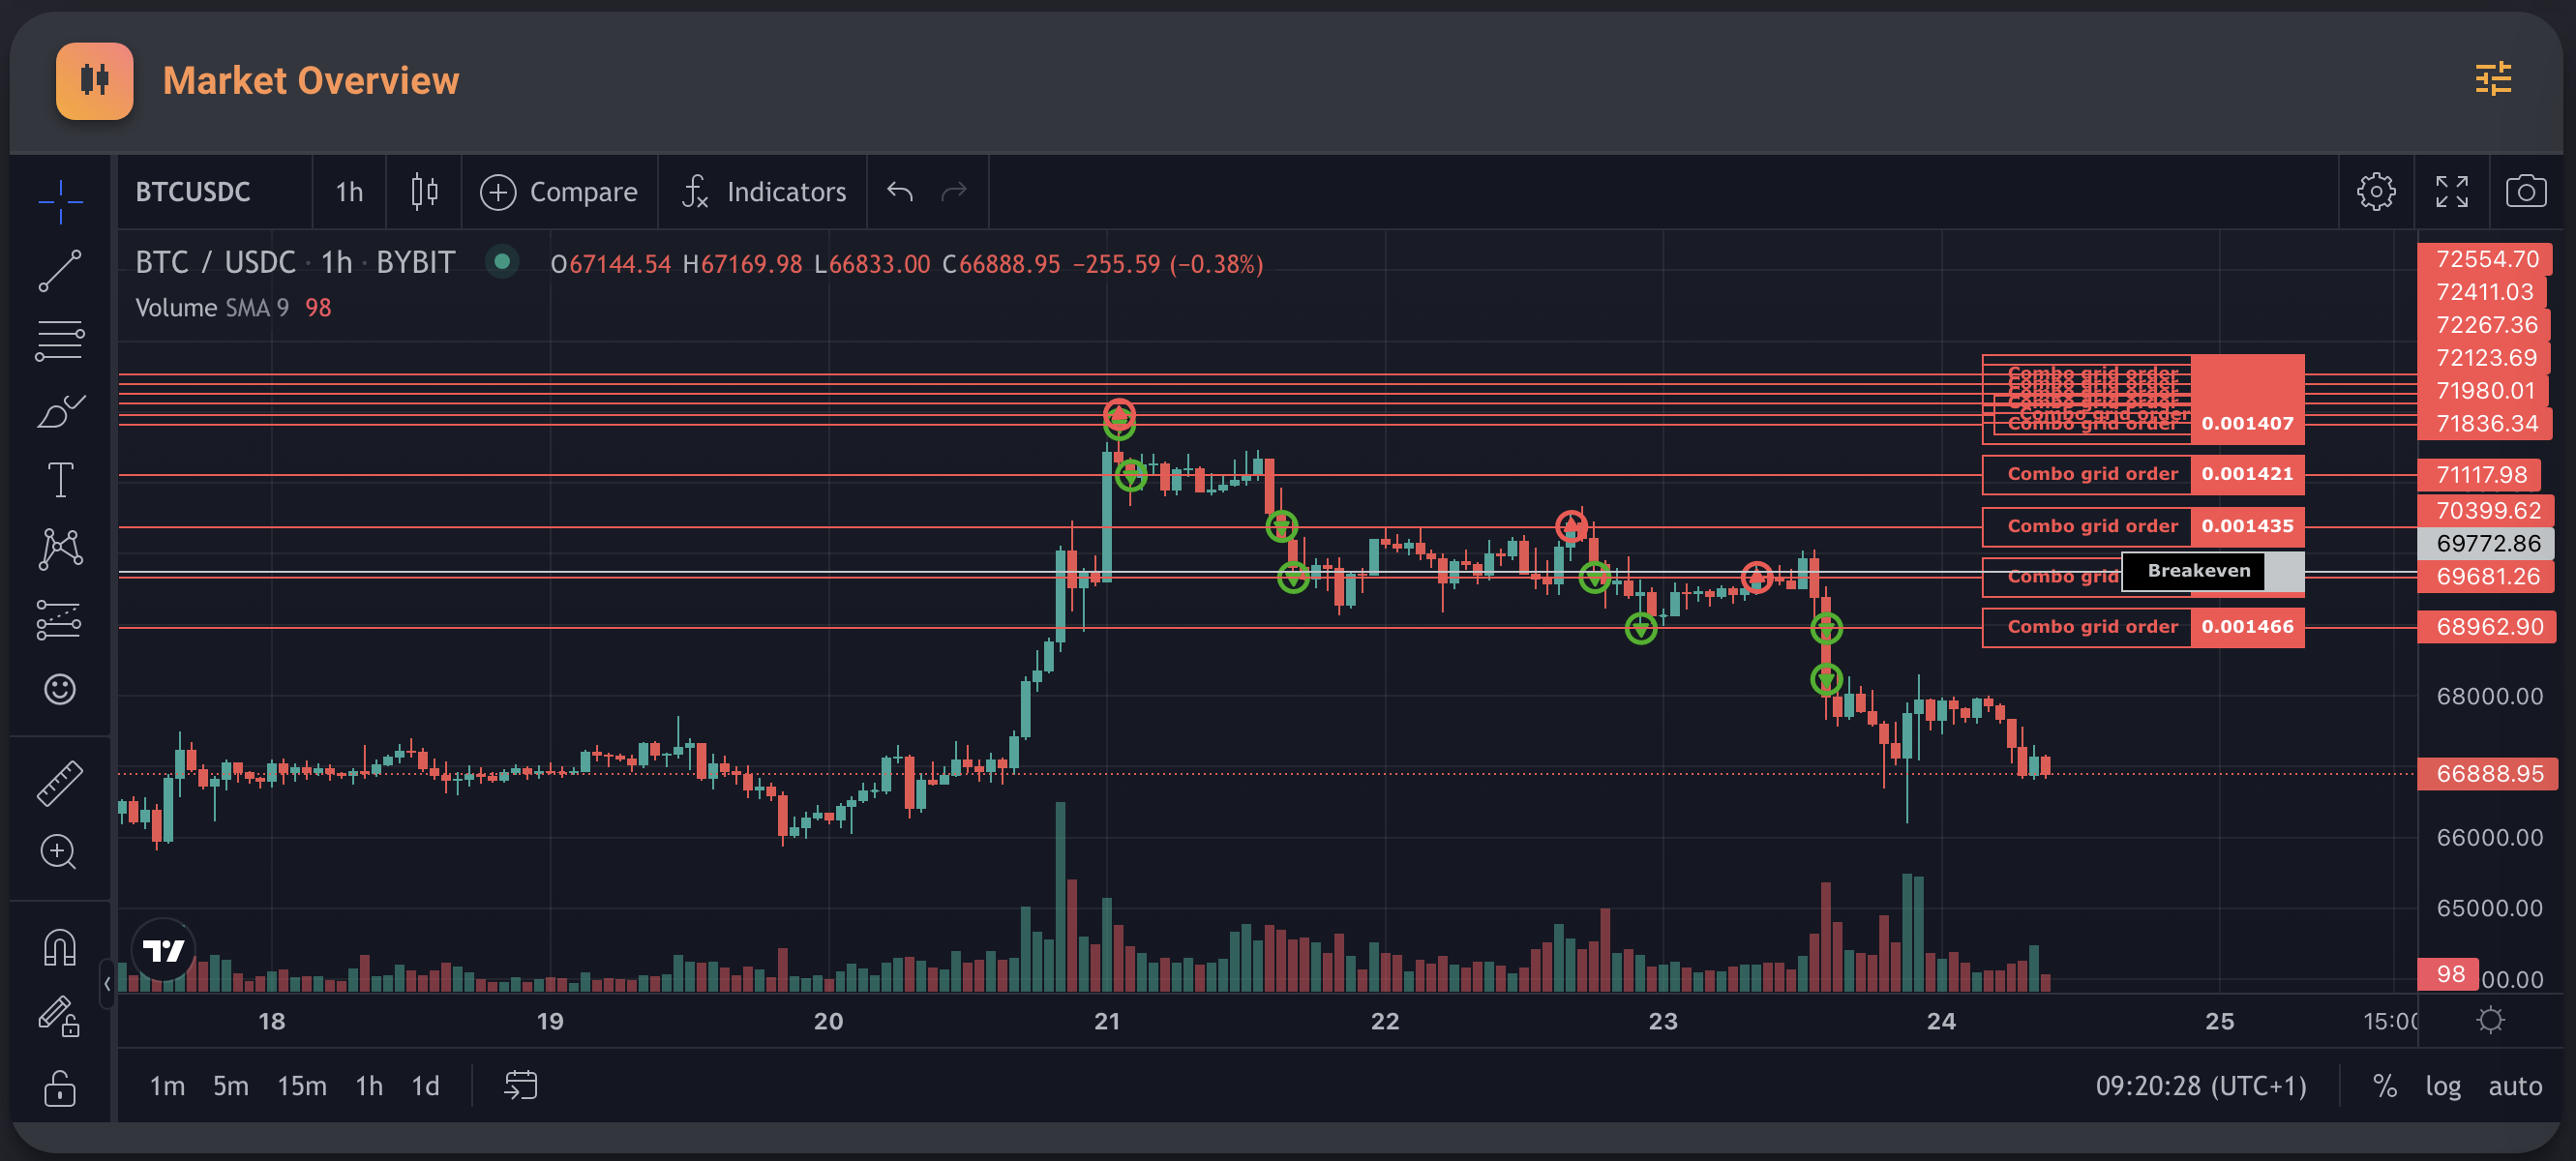
Because we are trading in price ranges we only need to focus on each range.
The picture below shows how effective is the concept of reducing the position size of our deal while DCAing.
Having only one minigrid into our DCAs allow us to reduce our position at every little push back while also averaging the price at every DCA - in essence we are forcing the price to exit to one direction.
The breakeven moves quicker even if we don’t scale our DCA size this is because on one side we buy at a more convenient price while it also sells each DCA in one go at every little push back
It’s impossible to cover 100% percent deviation with 4 deals of 25%. Once you open a new deal that point starts a new 100% range.
It’s a very low chance to need too many deals of 25% opened on BTC but I’ve seen this happened on altcoins that go to 0.
That wasn’t the answer. If you start with 0 % and BTC price $100,000. Why is a 50 % drawdown at $56 and according for the others. What’s the calculation behind it? Shouldn’t 100 % be BTC price $0?
I know you calculate 25 % drawdown from the last price for every deal. But those don’t sum up like -25 %, -50 %, -75 %, …
This is base on simultaneous deals looking at the first opened deal at $100K - so if it opens a deal at $100k but the price falls without recovering it will open a new deal every 25%
I get what you mean since now that we are placing an order from a lower price the % deviation and its relative $ coverage is different - I will need more time to add those but I’m happy for you if you want to add a column with the relative price and percentage if the deal was restarting from a new price